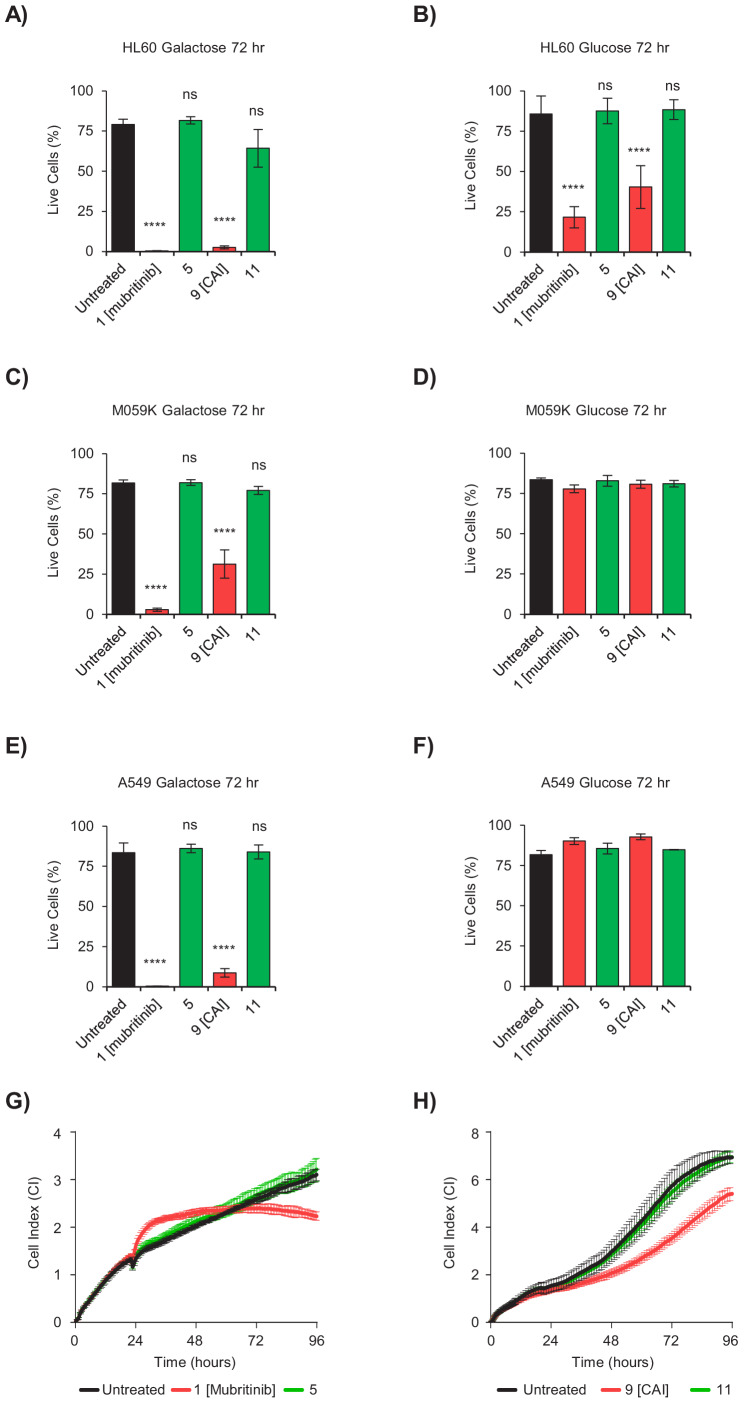
Figure 4. The toxicophore present in mubritinib and CAI is required for efficacy as an anti-cancer agent.
(A and B) HL60 cells grown in media containing galactose (A) or glucose (B) as an energy source treated with mubritinib (1) (2 μM), CAI (9) (5 μM) or the inactive derivatives 5 (2 μM) or 11 (5 μM) for 72 hr. The percentage of live cells was assessed by DRAQ7 staining and Annexin-V-FITC labelling. Error bars represent standard deviation (n = 3) and significance relative to the untreated control sample was assessed using ANOVA with Dunnett’s multiple comparisons test (****p<0.0001, ns = not significant). (C and D) M059K cells grown in media containing galactose (C) or glucose (D) as an energy source treated with mubritinib (1) (2 μM), CAI (9) (5 μM) or the inactive derivatives 5 (2 μM) or 11 (5 μM) for 72 hr. The percentage of live cells was assessed by DRAQ7 staining and Annexin-V-FITC labelling. Error bars represent standard deviation (n = 3) and significance relative to the untreated control sample was assessed using ANOVA with Dunnett’s multiple comparisons test (****p<0.0001, ns = not significant). (E and F) A549 cells grown in media containing galactose (E) or glucose (F) as an energy source treated with mubritinib (1) (2 μM), CAI (9) (5 μM) or the inactive derivatives 5 (2 μM) or 11 (5 μM) for 72 hr. The percentage of live cells was assessed by DRAQ7 staining and Annexin-V-FITC labelling. Error bars represent standard deviation (n = 3) and significance relative to the untreated control sample was assessed using ANOVA with Dunnett’s multiple comparisons test (****p<0.0001, ns = not significant). (G) Cell proliferation profiles from xCELLigence RTCA DP instrument. BT474 cells grown in glucose containing media were seeded in an E-plate 16 and after 24 hr were treated with either 5 μM mubritinib (1) or the derivative compound five which contains a modified triazole ring. The cell index was monitored for 96 hr to determine cell proliferation rates. Error bars represent standard deviation (n = 3). (H) Cell proliferation profiles from xCELLigence RTCA DP instrument. A549 cells grown in glucose containing media were seeded in an E-plate 16 and after 20 hr were treated with either 5 μM CAI (9) or the derivative compound 11 which contains a modified triazole ring. The cell index was monitored for 120 hr to determine cell proliferation rates. Error bars represent standard deviation (n = 3).


