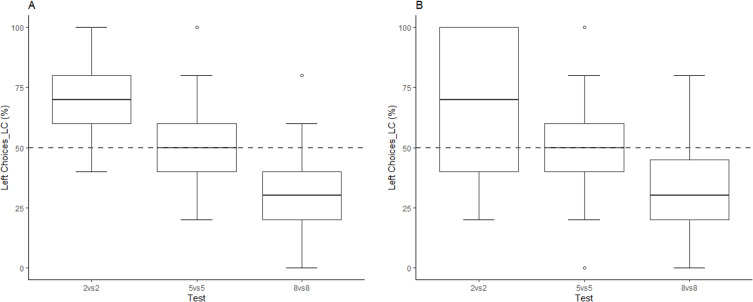
Figure 1. Left Choices (LC) as a function of numerical magnitudes.
Left Choices (means, SE, 1Q and 3Q) in each test of Experiment 1 (A) and Experiment 2 (B). Dotted lines represent the chance level and dots represent the outliers, which were included in the final sample. Below, for each experiment we reported the Bayesian and the frequentist one-sample t-test vs. chance level. Experiment 1: Chicks took more left-sided choices when facing smaller magnitudes (two: BF >100; p<0.001, Cohen’s d = 1.572), and more right-sided choices when facing larger magnitudes (eight: BF >100; p<0.001, Cohen’s d = 1.505) than the one experienced during training (five); in the 5 vs. 5 test they did not show any bias (BF = 0.321; p=0.522, Cohen’s d = 0.151). Experiment 2: Chicks took more left-sided choices when facing smaller magnitudes (two: BF = 51.417; p<0.001, Cohen’s d = 1.072), and more right-sided choices when facing larger magnitudes (eight: BF = 23.070; p<0.001, Cohen’s d = 0.979) than the one experienced during training (five); in the 5 vs. 5 test they did not show any bias (BF = 0.291; p=0.863, Cohen’s d = 0.05).

