. 2020 Jun 25;9:e56935. doi: 10.7554/eLife.56935

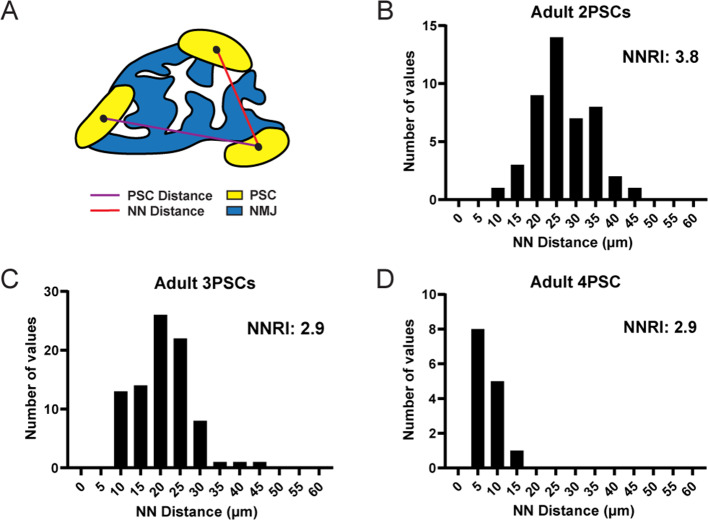
Figure 4. PSC distribution at the NMJ is non-random and ordered.

(A) The nearest neighbor (NN) distance, or the distance between a PSC and the closest neighboring PSC, is represented by the red line. The distance represented by the purple line is not considered for NN analysis. The distribution of NN values (shown in panels B, C, and D) is used to determine the degree of order in PSC distribution, as represented by the nearest neighbor regularity index (NNRI). Distribution patterns with an NNRI value greater than 1.91 are considered to be non-random. (B–D) Nearest neighbor distributions of S100-GFP+;NG2-dsRed+ PSCs in adult (P60) EDL muscle show that PSC distributions have orderly patterns of distribution with NNRI > 1.91 regardless of whether they are located at an NMJ with 2 PSCs (B), 3 PSCs (C), or 4 PSCs (D).

Figure 4.

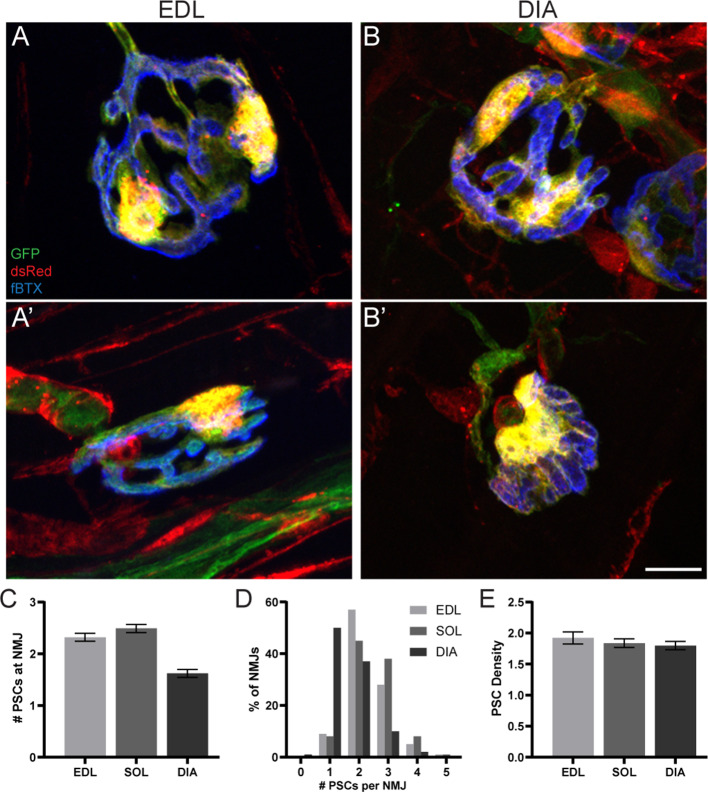
Figure 4—figure supplement 1. The number of PSCs associated with an NMJ varies but PSC density remains constant in the EDL, soleus (SOL), and diaphragm (DIA) muscles of adult mice.

Figure 4—figure supplement 1.

(A–B) Representative images of NMJs, identified by nAChR clusters with fBTX (blue), in the (A) EDL and (B) diaphragm of adult S100β-GFP (green);NG2-dsRed (red) mice. (C) An analysis of the average number of PSCs at an NMJ shows that there are fewer PSCs at NMJs in the diaphragm as compared to the EDL and soleus. (D) An analysis of NMJs based on PSC number shows that the diaphragm has more NMJs with 1 PSC and fewer NMJs with 3 PSCs as compared to EDL and soleus. (E) When standardizing for NMJ size, the density of PSCs at NMJs is unchanged between the EDL, soleus and diaphragm. Error bar = standard error of the mean. Scale bar = 10 μm.