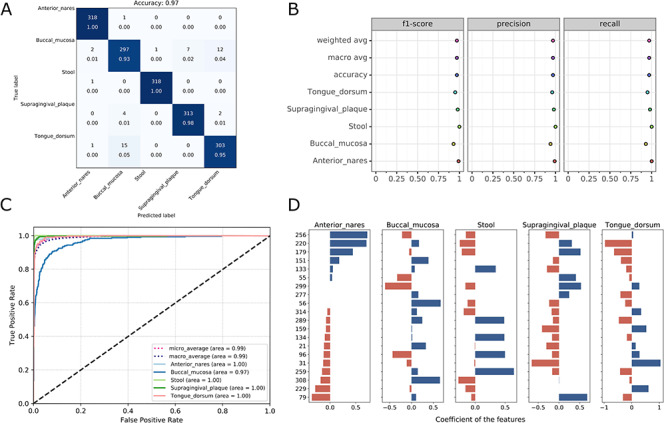
Figure 4.

Visualizations for the optimized model: the heatmap for confusing matrix (A), the classification report (B), ROC curve (C) and the histogram for top features (D, default: 20). Note that, in the case of tree-based models, the feature importance will be provided instead of the feature’s coefficient in the histogram.
