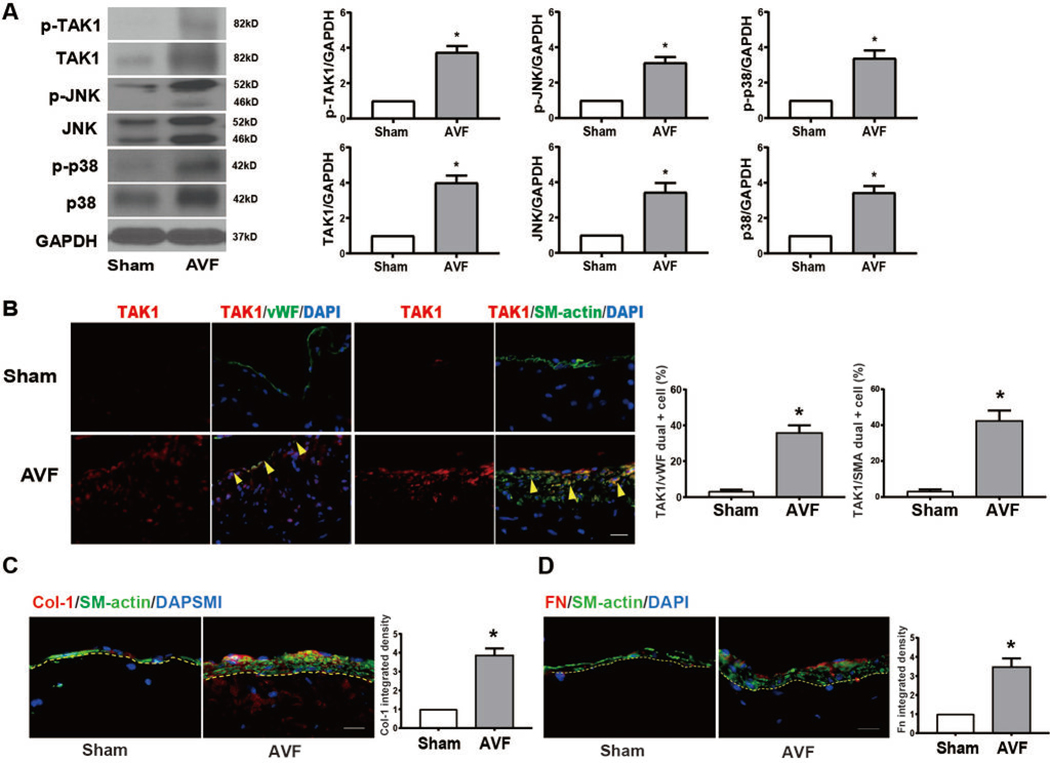
Fig. 2. TAK1 is upregulated during AVF maturation in a mouse AVF model.
(A) Representative Western blot images and quantitative data showing increased protein expression of p-TAK1 (p=0.015), TAK1 (p=0.0012), p-JNK (p=0.0027), JNK (p=0.0051), p-p38 (p=0.0056), p38 (p=0.0099), in AVF, normalized to GAPDH (n=3). (B) Representative images showing TAK1 expression in the IVC of sham-operated mice or AVF (n=4); scale bar, 100 μm. Adjacent bar graphs show expression of TAK1 in the endothelial cells (n=4; p=0.0019, t test) or SMC (n=4; p=0.0026). (C) Representative images and summary bar graph showing expression of collagen I in AVF (day 21), compared to IVC (n=3; p=0.0016), scale bar, 100 μm. (D) Representative images and summary bar graph showing expression of fibronectin in AVF and IVC (n=3; p=0.0056), scale bar, 100 μm. Statistical tests used: Student’s t test.

