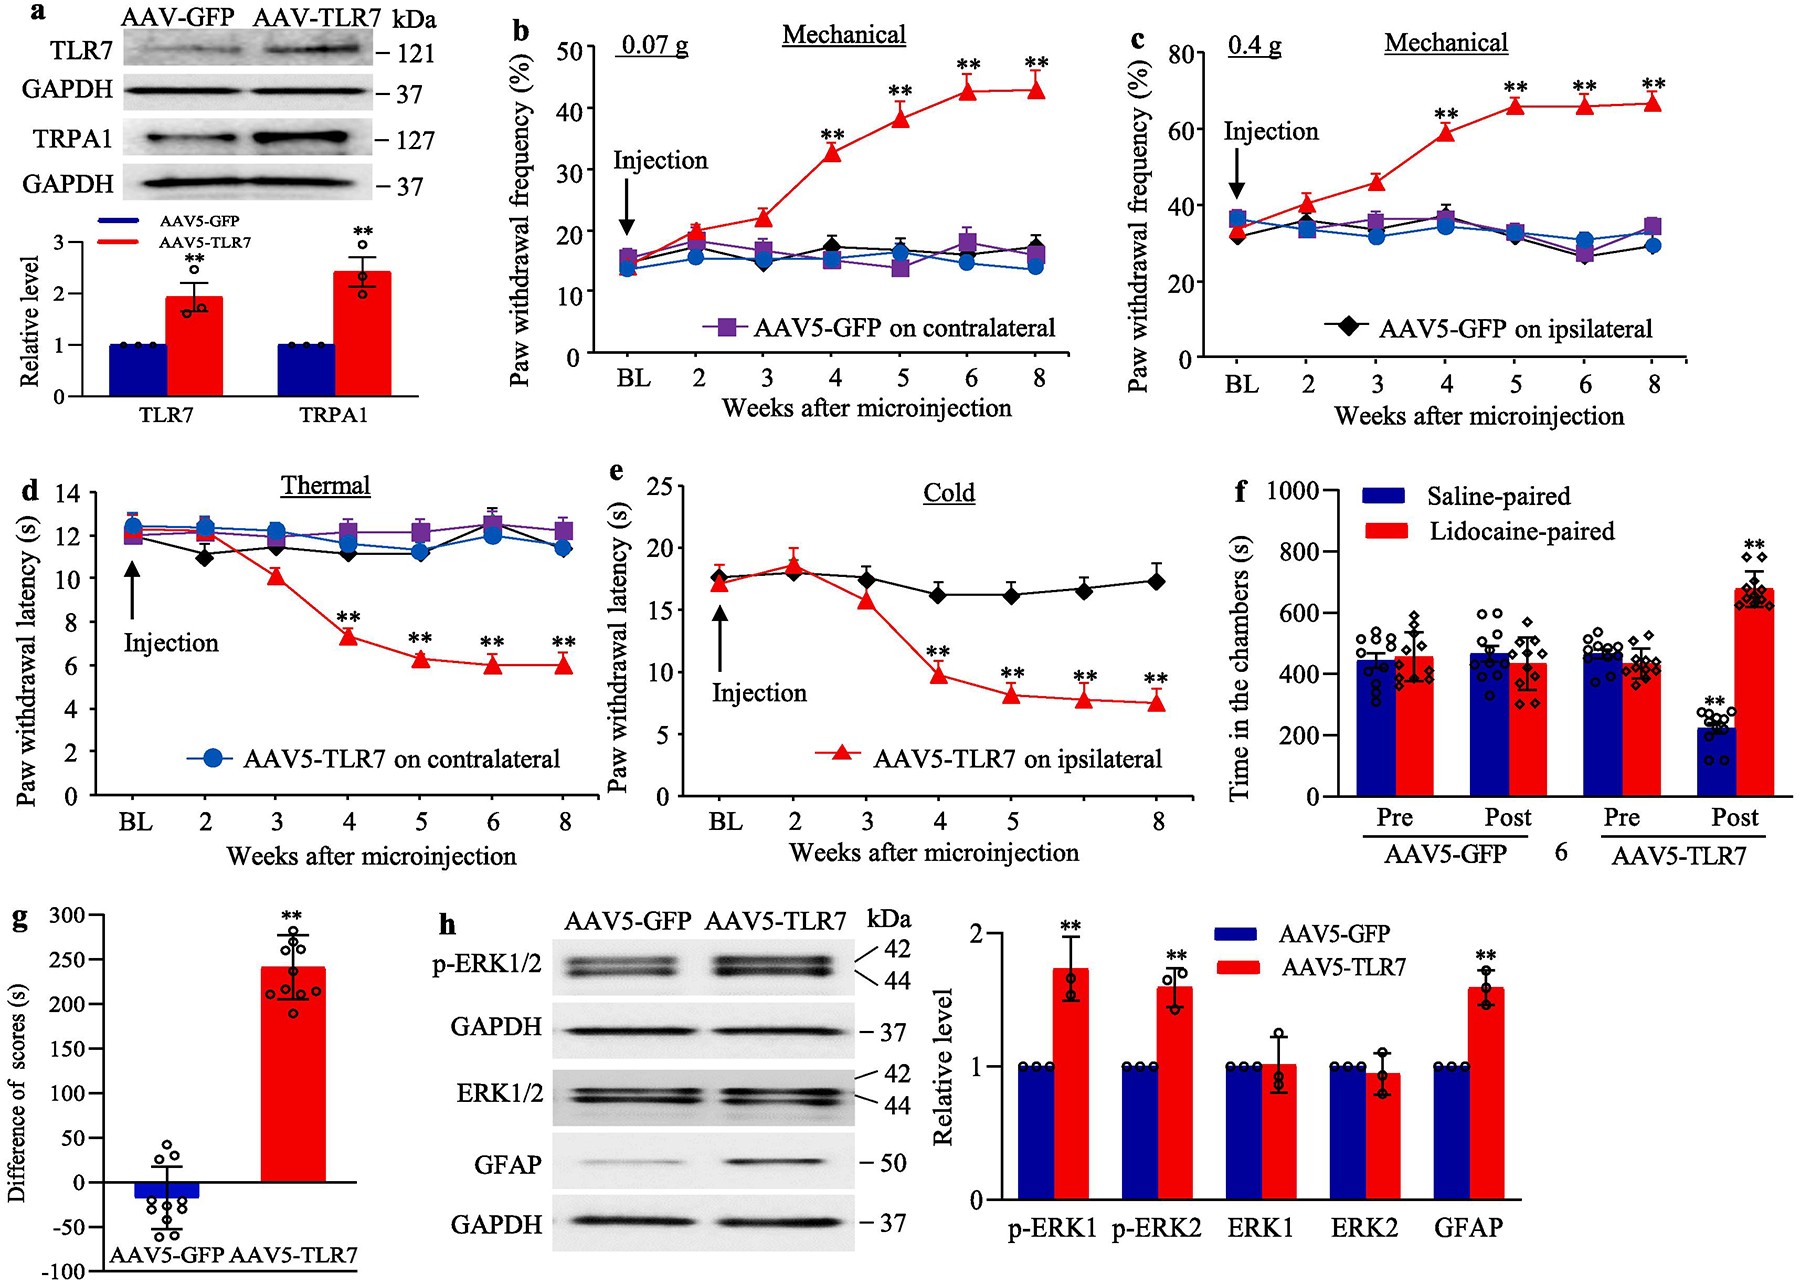
Fig. 7.

Effect of DRG TLR7 overexpression on nociceptive thresholds and dorsal horn central sensitization in naïve mice (a) The levels of TLR7 and TRPA1 proteins in the ipsilateral L3/4 DRGs 8 weeks after microinjection of AAV5-TLR7 or control AAV5-GFP. n = 3 biological repeats (6 mice)/group. **P < 0.01 vs the AAV5-GFP group. Two-tailed, independent Student’s t test. (b–e) Effect of microinjection of AAV5-TLR7 or AAV5-GFP into the unilateral L3/4 DRGs on paw withdrawal frequencies to low (0.07 g; b) and median (0.4 g; c) force von Frey filament stimuli and paw withdrawal latencies to thermal (d) and cold stimuli (e) on both ipsilateral and contralateral sides at the different weeks after AAV5 microinjection. n = 10 mice/group. BL: baseline. **P < 0.01 vs the control AAV5-GFP group at the corresponding time points on the ipsilateral side. Two-way ANOVA with repeated measures followed by Tukey post hoc test. (f, g) Effect of microinjection of AAV5-TLR7 or AAV5-GFP into the unilateral L3/4 DRGs on spontaneous ongoing pain as assessed by the CPP paradigm. n = 10 mice/group. **P < 0.01 vs the corresponding preconditioning by two-way ANOVA with repeated measures followed by Tukey post hoc test (f) or the AAV5-GFP group by two-tailed, independent Student’s t test (g). (h) Effect of microinjection of AAV5-TLR7 or AAV5-GFP into the unilateral L3/4 DRGs on dorsal horn central sensitization evidenced by the increases in the phosphorylation of ERK1/2 (p-ERK1/2) and abundance of GFAP in the ipsilateral L3/4 dorsal horn 8 weeks after viral microinjection. Representative Western blots (left panels) and a summary of densitometric analysis (right graphs) are shown. n = 3 biological repeats (6 mice)/group. **P < 0.01 vs the corresponding AAV5-GFP group. Two-tailed, independent Student’s t test. Full-length blots are presented in Supplementary Figure 1.
