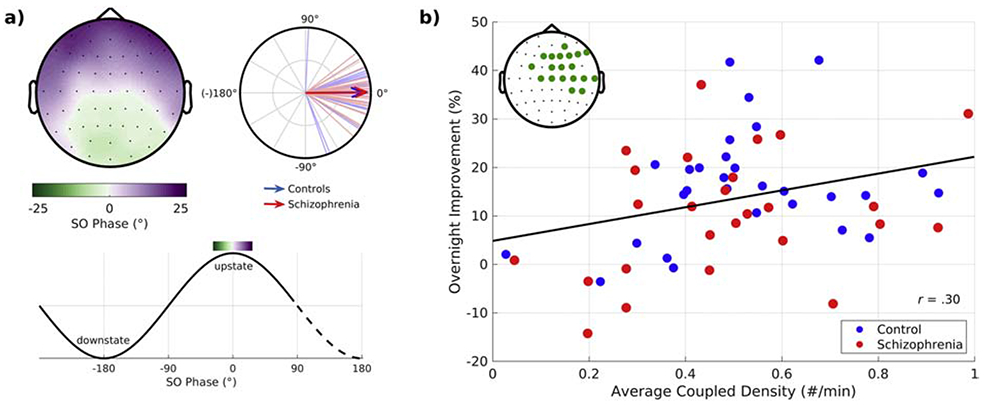
Figure 2:

The temporal coordination of spindles with slow oscillations (SOs) in relation to sleep-dependent memory consolidation. a) SO phase at spindle peak. Top row: Topographical maps show mean SO phase at the peak of the spindle averaged across schizophrenia and healthy control participants. The circular plot shows the SO phase distributions across participants at Cz. Lines represent the mean SO phase for each participant. Arrows represent group means and their length represents the consistency of the SO phase across participants. Bottom row: Mapping of SO phase to the topographical map. b) Overnight improvement on a procedural motor memory task it is plotted against the density of coupled spindle-SO events in the electrode cluster showing a significant correlation (inset shows the electrodes comprising the significant cluster). The regression line for the combined groups is shown.
