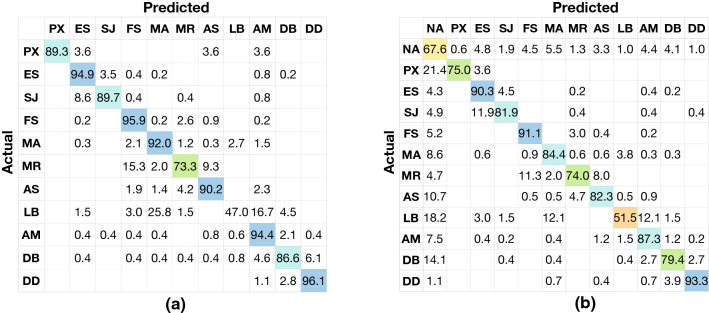
Fig. 5.
Confusion matrix for the model based on a the proposed guideline without NA and b the proposed guideline with NA. The actual labels are on the left side of the confusion matrix, and the predicted labels are on the bottom of the confusion matrix. a has 11 classes, and b has 12 classes. The values on the diagonal grids showed the recall rates (%) of each class, respectively, for the matrix. Referring to the colour of the colour bar and the corresponding number, the sample density in the confusion matrices is shown by colours

