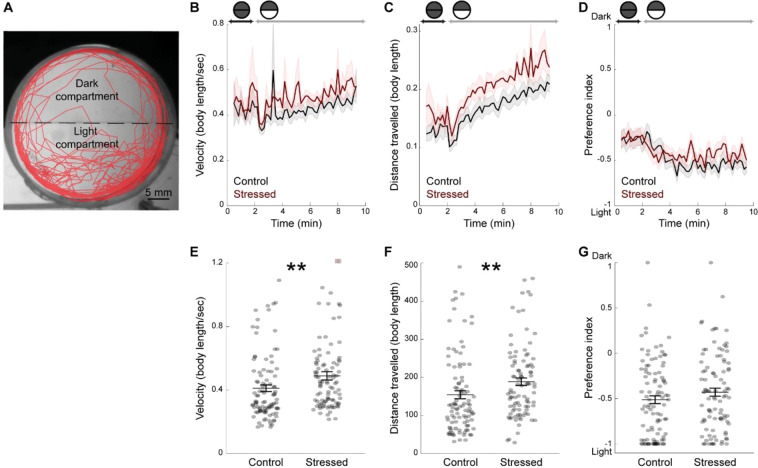
Figure 3.
No change in light preference, but increased light-induced locomotion two days post-CUS, in CUS-exposed fish. (A) Representative swimming trajectory (in red) of a 19 dpf fish during the dark-light test. Fish were initially maintained in the dark for two minutes (dark phase). Upon the start of illumination (light phase), they had the choice between a dark and a light compartment for eight minutes. (B) Average velocity during the dark and light phases, per time bins of twelve seconds, in body length/second. (C) Average distance travelled during the dark and light phases, per time bins of twelve seconds, in body length. (D) Preference index over time, during the dark and light phases, calculated per time bins of twelve seconds. (E) Average velocity of the fish during the light phase. The dot signaled by a red square was out of range (value = 2.07). (F) Total distance travelled by the fish during the light phase. (G) Preference index for the dark or the light compartments during the light phase. Values of −1 indicate 100% time spent in the light compartment and values of 1 indicate 100% time spent in the dark compartment. Each dot represents one fish (control: n = 99 fish; stressed: n = 94 fish). Data are represented as mean ± SEM. **p < 0.01, Kruskal-Wallis test.

