Figure 4.
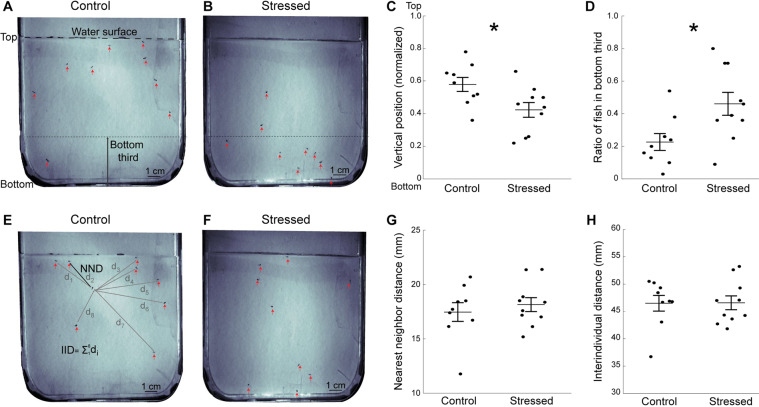
Decreased exploration of the novel tank in stressed fish tested one day post-CUS. (A) Representative image showing control fish’s position in the arena at the beginning of the novel tank test. The arena is vertically positioned and the dashed line at the top indicates the water surface. The red arrows indicate the fish, and the the bottom third of the tank is indicated. (B) Representative image showing stressed fish’s position at the beginning of the novel tank test. (C) Average vertical position of all fish during the early phase of the novel tank test (see Methods). (D) Ratio of fish in the bottom third of the tank. (E) Representative image showing control fish’s position relative to each other in the late phase (from three to ten minutes) of the novel tank test, in the same group as in A. The black line indicates the distance from a fish to its nearest neighbor (NND). The grey lines indicate the distance between one fish to the other fish in the tank that are used for interindividual distance (IID) calculations. (F) Representative image showing stressed fish’s position in the late phase of the novel tank test, in the same group as in (B). (G) Average nearest neighbor distance for all fish in the arena from three to ten minutes. (H) Average interindividual distance for all fish in the arena from three to ten minutes. Each dot represents the average value for one group of fish (control: n = 9 groups; stressed: n = 10 groups). Data are represented as mean ± SEM. *p < 0.05, Student’s t-test.

