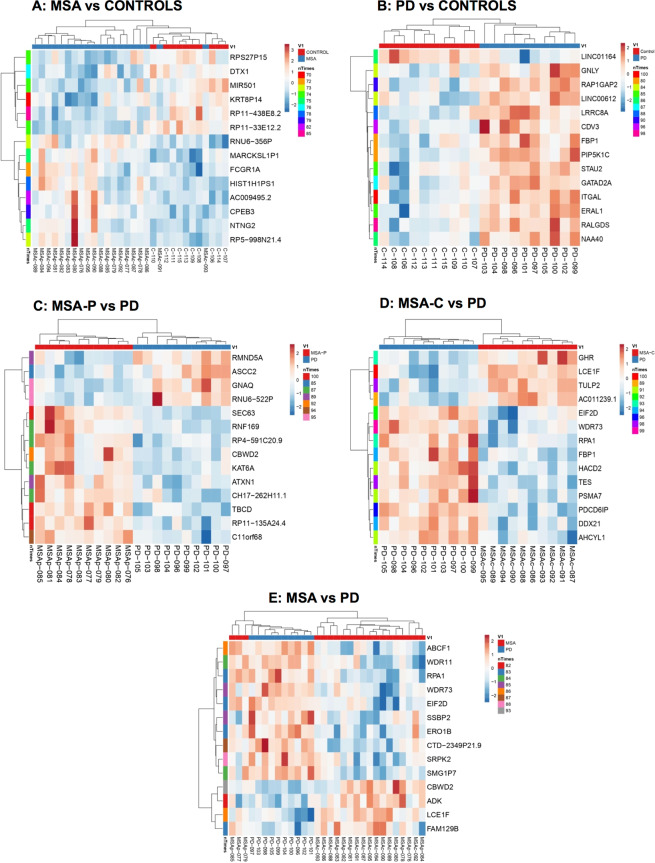
Figure 1.
Resampling analysis heatmap representations. Heatmap representation of differentially expressed transcript cluster ID (DE TCI) detected across comparisons by resampling analysis (RA) for contrasts MSA vs. Controls (A), PD vs. Controls (B), MSA-P vs. PD (C), MSA-C vs. PD (D), MSA vs. PD (E). N indicates number of iterations a gene was found to be differentially expressed out of 100 iterations. Unsupervised tree ordering for clusters is given by tightest clusters first, with both rows and columns clustered using correlation distance and average linkage. Red shading indicates up-regulation and blue shading indicates down-regulation. Note that when analyzing by clinical phenotype heatmap discrimination improves. PD = Parkinson disease, MSA = Multiple system atrophy (P = Parkinsonian phenotype, C = Cerebellar phenotype).

