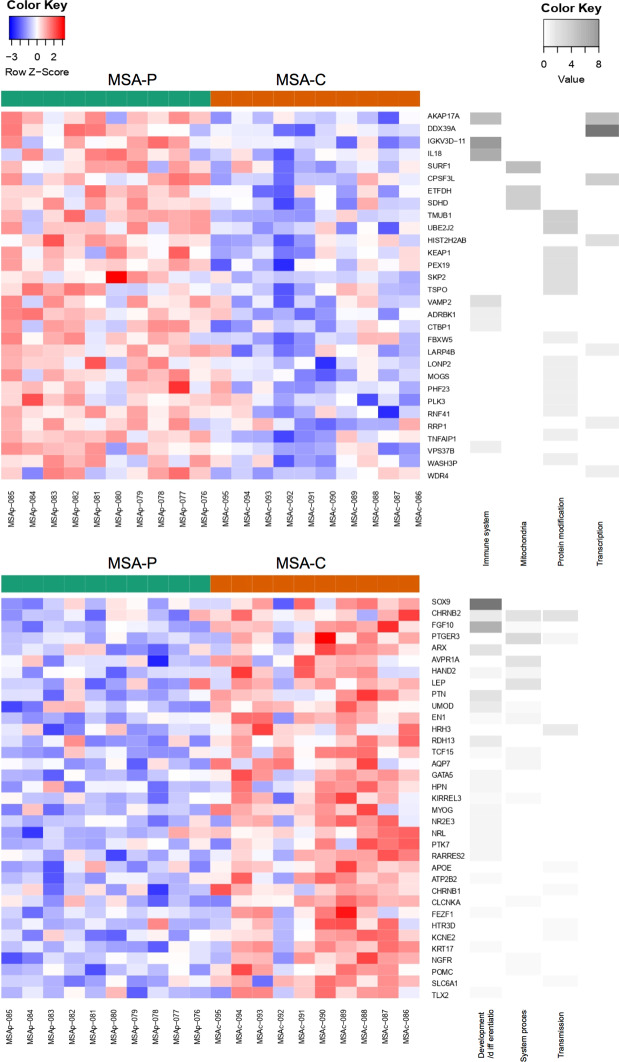
Figure 3.
GSEA analysis in MSA-P vs. MSA-C. Positive enrichment GSEA results comparing MSA-P vs. MSA-C on top and negative enrichment below, represented as heatmaps where green indicates MSA-P cases and orange indicates MSA-C cases, red shading represents up-regulation and blue shading down-regulation. Grey scale heatmap to the left of color heatmap indicates each gene’s corresponding biological processes. Only genes that were related to these specific biological processes have been selected with a cut-off p-value < 0.01. MSA = Multiple system atrophy (P = Parkinsonian phenotype, C = Cerebellar phenotype).

