Figure 4.
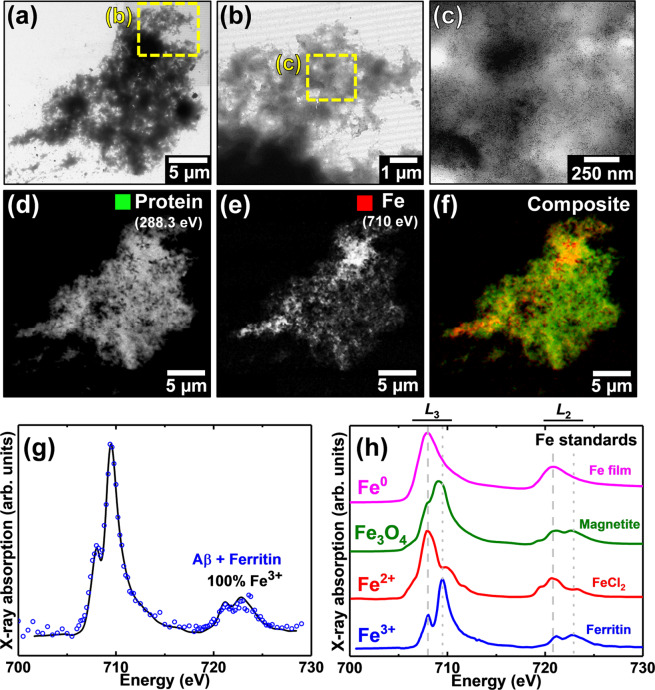
TEM and STXM analysis of an Aβ/ferritin aggregate formed following 48 hours of co-incubation. (a-c) TEM images of the Aβ/ferritin aggregate. Uniformly distributed electron dense fine particles can be seen in the highest magnification image in (c). STXM speciation dependent maps (d-f) and an iron L2,3-edge X-ray absorption spectrum (g) from the aggregate. (d) Carbon K-edge protein map. (e) Iron L3-edge map. (f) Composite image displaying protein (green) and iron (red) content of the aggregate. (g) Iron L2,3-edge X-ray absorption spectrum from the iron content displayed in (e). The solid line for the spectrum corresponds to the best fit curve created by superposition of suitably scaled iron reference X-ray absorption spectra. (h) Reference iron L2,3 edge X-ray absorption spectra for ferric (ferritin standard; blue), ferrous (FeCl2; red), magnetite (Fe3O4; green) and elemental (Fe0; magenta) iron phases. Grey dashed and dotted lines indicate the energy positions of the principal Fe2+ and Fe3+ absorption peaks respectively. See also Supplementary Fig. S3 for additional ferritin iron L2,3-edge X-ray absorption spectra.

