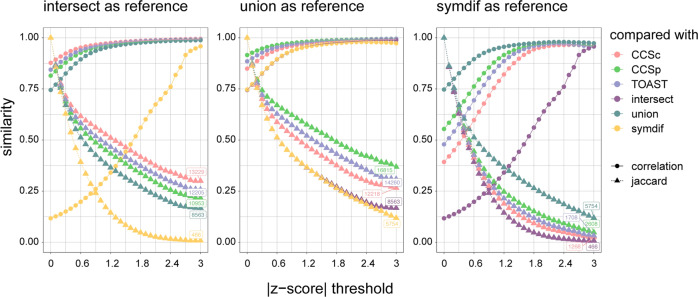
Fig. 4. Different phenotype definitions capture different genetic risk factors.
Overlap analysis in cardioembolic stroke. Similarity on the y-axis denotes either correlation (circles) or Jaccard index (triangles). The absolute z-score threshold is plotted on the x-axis. Numbers indicate the number of shared SNPs at Z = 3. a Pairwise comparisons with intersect, b pairwise comparisons with union, c pairwise comparisons with symmetric difference.

