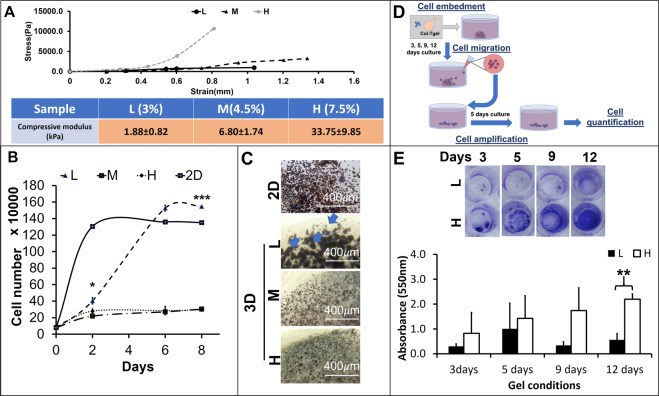
Figure 1.
Alteration of Raw264.7 cells proliferation, cluster formation, and mobility by the 3D matrices. (A) The 3D matrices in different concentrations were measured their compressive modules by the unconfined compression test (n = 6, average ± standard deviation, (B). The scatter plot of cell proliferation in 3D matrices. The proliferation rates were calculated by counting the cell number from the Raw264.7 embedded in different 3D matrices, n = 3, 2nd day: p = 0.1251, 6th day: *p < 0.05, 8th day: ***p < 0.001); (C) The cluster formation patterns. Optic images on the Raw264.7 cells embedded in different 3D matrices with MTT staining (blue arrows). (D) A diagram to illustrate the proposed experimental procedure for quantification of the migrated cells. (E) The absorbance measurement of the migrated Raw264.7 cells from the 3D matrices to culture medium, crystal violet staining at 3, 5, 9, and 12 days, n = 3, **p < 0.01.

