Figure 5.
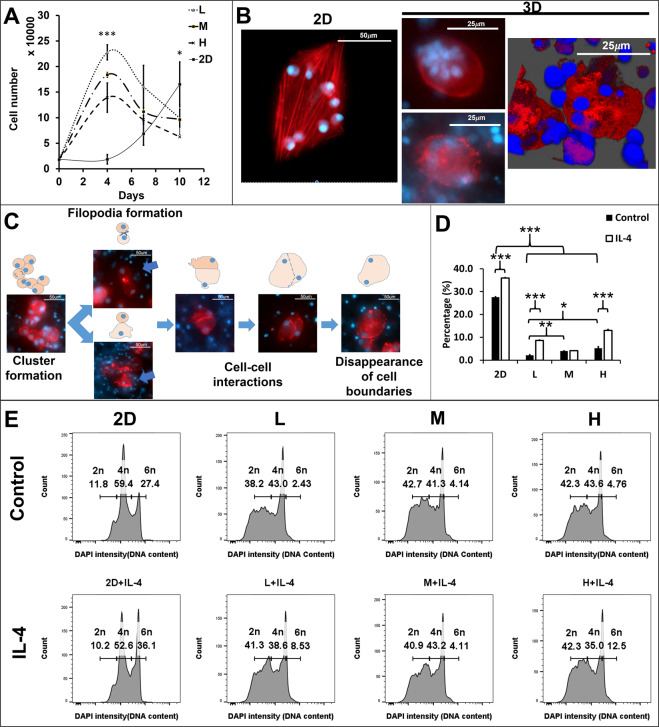
Modulation of rat bone marrow derived monocytes (BMDM) fusion by the 3D matrices. (A) The proliferation curves were derived from the 2D and 3D (L, M, and H) cultured BMDM for 0, 4, 7 10 days; (n = 3), 4th day: ***p < 0.001, 7th day: p = 0.093, 10th day: *p < 0.05, (B) The fused BMDM morphologies were detected by F-actin (rhodamine phalloidin, red) and nuclei (DAPI, blue) staining in 2D and 3D culture (L matrix) at day10. (C) Flourescence images with schematic diagrams to describe BMDMs fusion process. (D) The fusion rate of BMDM in the 2D and 3D (L, M, and H matrices) cultures for 10 days (n = 3), ***p < 0.001, **p < 0.01, and *p < 0.05. (E) The histograms of the DAPI intensity (DNA content) of the 2D and 3D (L, M, and H matrices) cultured BMDM for 10 days.

