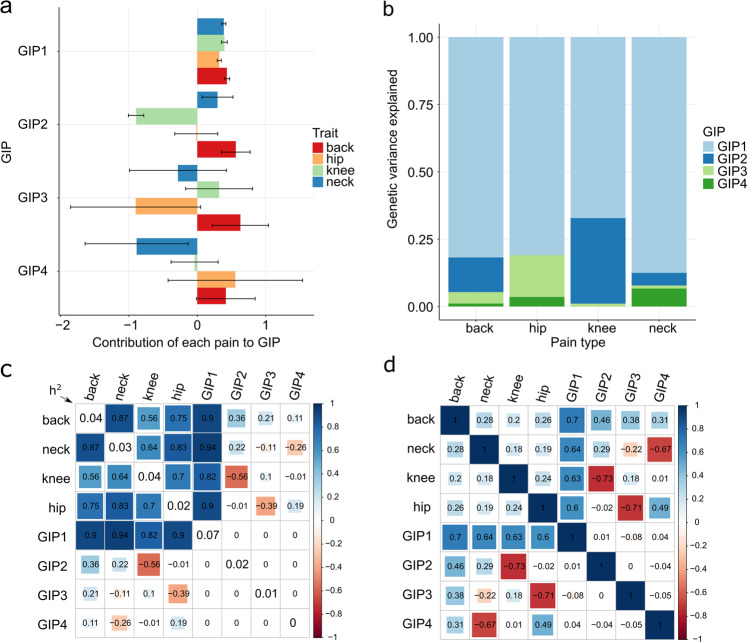
Fig. 2. Genetically independent phenotypes (GIP) for chronic musculoskeletal pain.
a Barplots depicting the contribution of the four chronic musculoskeletal pain traits to each GIP. The bars represent orthogonal transformation coefficients, and the whiskers indicate their 95% confidence intervals. The violin plots depicting the empirical distribution of the coefficients of orthogonal transformation are presented in Supplementary Fig. 1. b Genetic variance of the studied chronic musculoskeletal pain explained by four GIPs. c. Estimated matrix of genetic correlations between the four chronic musculoskeletal pain phenotypes and GIPs. The diagonal elements represent LD Score regression estimates of SNP-based heritability (h2) on the observed scale for each trait. d Matrix of phenotypic correlations between the four chronic musculoskeletal pain phenotypes and GIPs (estimated for pain phenotypes and predicted for GIPs, details are given in Supplementary Methods). Estimates for c, d were obtained using the discovery cohort of European ancestry individuals (N = 265,000).

