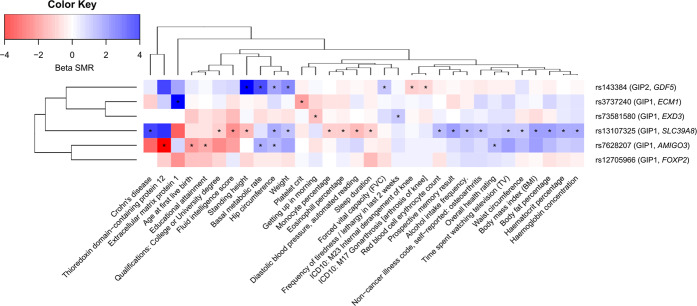
Fig. 4. Pleiotropic effects of identified loci on human complex traits.
Color depicts the sign and the magnitude of SMR beta coefficient. Negative sign (red) means opposed effects on the corresponding GIP and the trait, and positive sign (blue) means the same direction of effect. |beta SMR | > 4 are depicted as |beta SMR | = 4. For “Prospective memory result” and “Overall health rating” trait, high scores correspond to poor performance. For “Getting up in morning” trait, high score corresponds to easy getting up. Traits that passed both SMR and HEIDI tests (PSMR < 3.71e-06 and PHEIDI ≥ 0.01) are marked with an asterisk. Data on 45 out of 78 revealed traits are not shown. Full results are given in Supplementary Data 10. GIPs associated with the loci and genes nearest to lead SNPs are indicated in parentheses. Dendrograms represent clustering based on complete linkage hierarchical clustering method.

