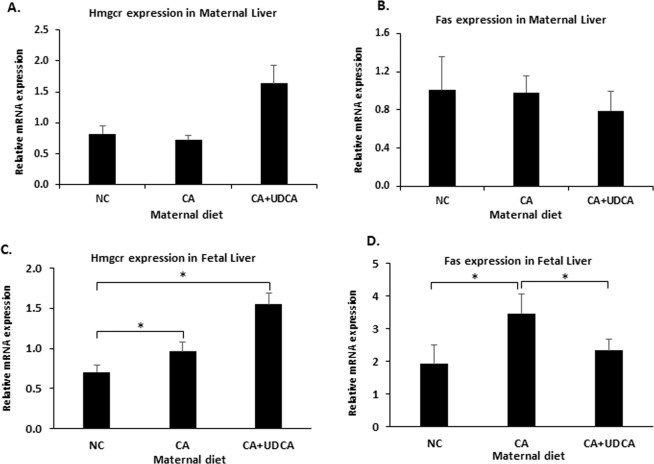
Figure 5.
Effects of UDCA on lipid gene expression profile in mouse hypercholanemic pregnancy. (A) Hmgcr mRNA expression in maternal liver. (B) Fas mRNA expression in maternal liver (C) Hmgcr mRNA expression in fetal liver (D) Fas mRNA expression in fetal liver. Data are presented as mean and standard error of the mean (sem) and were analyzed with multiple measures of ANOVA followed by Neuman Keul’s post-hoc testing. NC n = 6, CA n = 6, CA + UDCA n = 4. *p < 0.05 between comparisons connected by lines. NC: normal chow; CA: diet supplemented with cholic acid; CA + UDCA: diet supplemented with cholic acid + ursodeoxycholic acid; Hmcr: HMG-coA reductase; Fas: fatty acid synthase.

