Figure 6.
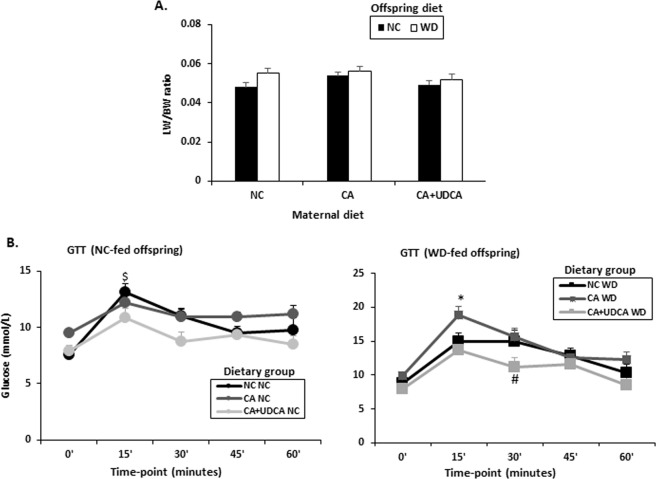
Effects of UDCA on liver to body weight ratio and glucose tolerance in offspring of mouse hypercholanemic pregnancy. (A) Effects of UDCA on liver to body weight ratio (B) Effects of UDCA on glucose tolerance in NC-fed and WD-fed female offspring of maternal hypercholanemia. Data are presented as mean and standard error of the mean (sem) and were analyzed with multiple measures of ANOVA followed by Neuman Keul’s post-hoc testing. $p < 0.05 0′ vs 15′, *p < 0.05 15′ CA WD vs 15′ NC/CA + UDCA WD, #p < 0.05 30′ CA WD vs 30′ NC/CA + UDCA WD, NC n = 6, CA n = 6, CA + UDCA n = 4. NC/CA/CA + UDCA represent maternal diet; NC/WD represent offspring diet. LW/BW: liver weight/body weight; NC: normal chow; WD: western diet; GTT: glucose tolerance test.

