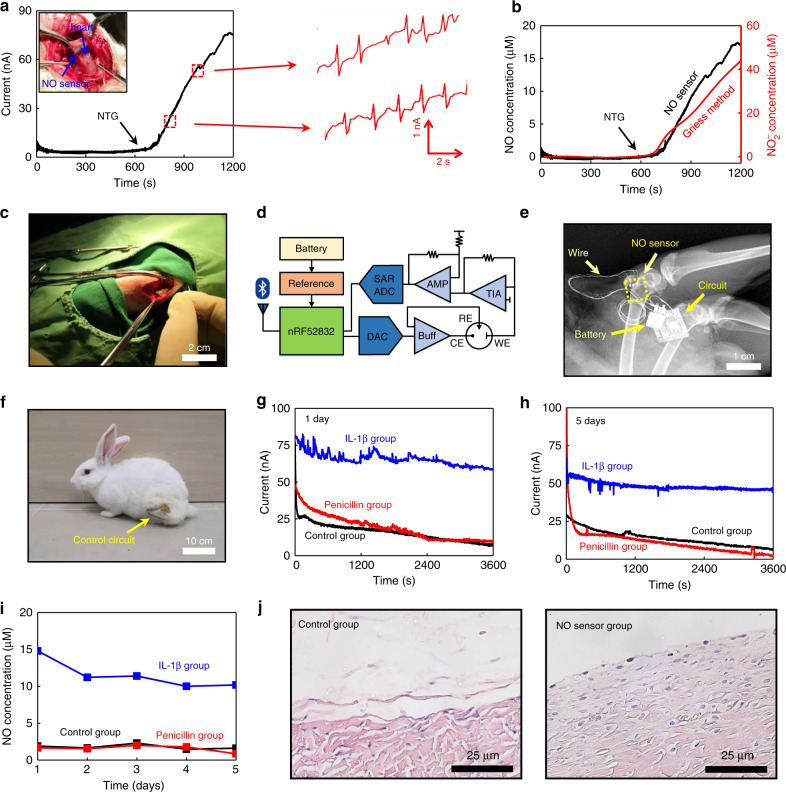
Fig. 5. In vivo real-time monitoring of NO concentrations in the heart and joint cavity of New Zealand rabbits.
a Real-time measurement of the response current of the NO release from the heart of the rabbit, stimulated by the intravenous infusion of nitroglycerine (NTG), with simultaneous electrocardiography (ECG) recordings from the NO sensor in the enlarged view. b Real-time monitoring of the NO concentration in the heart of a rabbit stimulated by NTG infusion (black), in comparison to accumulated NO2− concentrations measured by standard Griess tests (red). c Photograph of the surgical implantation of the NO sensor in the joint cavity of a rabbit. d Schematic diagram of wireless control and transmission system for the NO sensor. SAR ADC, successive approximation register analog-to-digital converter; DAC, digital-to-analog converter; Buff, buffer; AMP, amplifier; TIA, transimpedance amplifier. e X-ray image of the implanted NO sensor, wire connections and wireless module. f Photograph of the rabbit after NO sensor implantation with the wireless circuit immobilized on the thigh. g Real-time monitoring of the current response of NO after 1 day of implantation of the NO sensor in the joint cavity of a rabbit. h Real-time monitoring of current response after 5 days of implantation of the NO sensor in the joint cavity of a rabbit. i Real-time monitoring of NO concentration over 5 days (NO concentrations are converted from the measured response currents). In g–i, measurements are performed in three groups of rabbits after sensor implantation: IL-1β treatment (blue); penicillin treatment (red); and control group with no treatment (black). j Hematoxylin–eosin (HE) staining images of tissues at the implantation site after 8 weeks. In a–c and g–j, n = 3 independent experiments.

