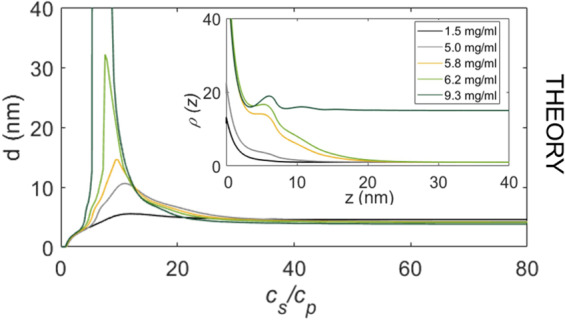
Figure 3.

DFT calculations. Protein layer thickness d versus cs/cp as obtained within DFT for different paths through the theoretically calculated phase diagram (Fig. 1(b)). The theoretical predictions of d agree qualitatively very well with those from experiments shown in Fig. 2(a), except for the path crossing the LLPS region. The divergence in the theory is due to the grand canonical ensemble. Note that due to the complexity of the system the canonical ensemble does not quantitatively describe the experiment. (inset) Protein density ρ(z) normalized to its value for z → ∞ corresponding to the adsorption maxima. When the LLPS region is crossed on the protein poor side, a macroscopically thick film of the protein rich phase can be found adsorbed at the attractive substrate (dark green line, cp = 9.3 mg/ml).
