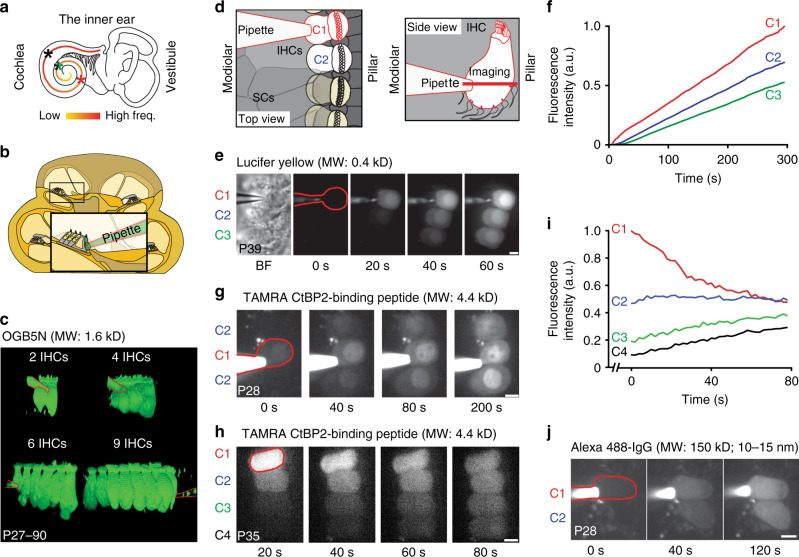
Fig. 1. Macromolecular coupling between mature mouse IHCs.
a Illustration of the cochlea with the tonotopic map color-coded for frequency and approximate positions of patching indicated with asterisks (red = mouse temporal bone preparation; green = mouse excised organ of Corti; black = gerbil excised organ of Corti (Supplementary Fig. 2)). b Drawing illustrating the temporal bone preparation, where the bone covering the apical turn is removed. c 3D view of OGB5N fluorescence in 2,4,6, and 9 coupled IHCs, with pipette delineated in red. d Drawings illustrating the excised organ of Corti with SCs removed to allow patching of one IHC (C1, outlined in red in e, g, h, and j), loaded IHCs in white (C1, C2), imaging plane as red bar. e Time series of Lucifer Yellow loading into 3 coupled IHCs, shown in bright field (BF) on the left. f Normalized fluorescence intensities over time from e. g Time series of TAMRA loading into 3 coupled IHCs. h TAMRA-peptide diffusion between 4 coupled IHCs after retracting the patch-pipette from C1. i Normalized fluorescence intensities over time from h. j Time series of Alexa 488-IgG loading in 2 coupled IHCs. a.u. arbitrary units, IHC inner hair cell, MW molecular weight, P postnatal day, SC supporting cell. Scale bar = 5 µm in e–j.

