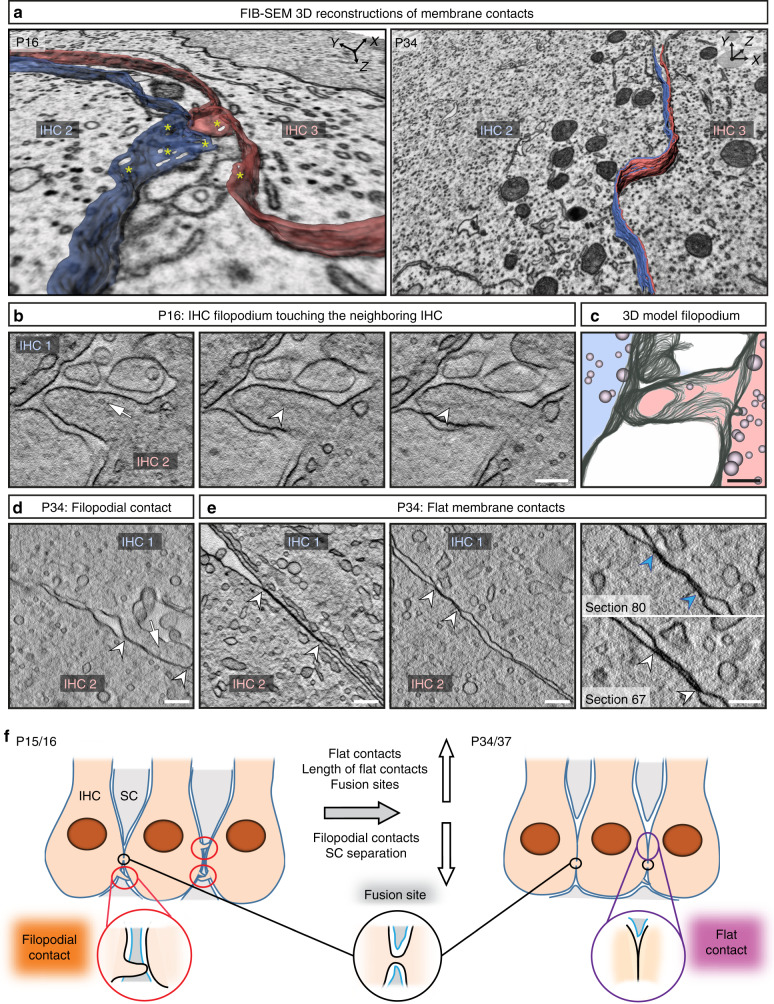
Fig. 6. FIB-SEM and electron tomography indicate close membrane contact sites between neighboring IHCs.
a 3D model of a filopodial contact in immature (P16) IHCs and a flat membrane contact in mature (P34) IHCs. Yellow asterisks highlight non-traceable membrane regions. b Example tomographic virtual sections from a high-pressure frozen/freeze-substituted (HPF/FS) P16 sample showing a filopodium reaching from one IHC to a neighboring IHC (10 virtual sections in z between two pictures, each section distance of 2.616 nm), arrow points to a vesicle, arrowheads to cytoskeletal filaments within filopodium. c 3D model of the filopodium. d Example tomographic virtual section from HPF/FS P34 IHCs depicting a filopodium (arrow) between two adjacent cells. The arrowheads indicate the membrane contact. e Further HPF/FS examples showing two virtual sections of flat IHC–IHC membrane contacts with different extensions in P34. Right panel: Two virtual sections from the same tomogram as in the middle panel. The membranes come very close and cannot be distinguished anymore in virtual section 80 (blue arrowheads), whereas two separate membranes are visible in section 67 (white arrowheads). Independent HPF/FS for electron tomography of each age group = 1; n tomograms (P16) = 1, Nanimals = 1, n tomograms (P34) = 12, Nanimals = 2. f Schematic illustrating the development of IHC membrane contacts based on the results from FIB-SEM and electron tomography: red circles: filopodial contacts, black circles: fusion sites, purple circles: purple flat membrane contacts. In immature organs of Corti, SCs enwrap the IHCs, while mature IHCs are forming extended flat cell-to-cell membrane contacts. FIB-SEM focused ion beam-scanning electron microscopy, IHC inner hair cell, SC supporting cell. Scale bar: b–e = 200 nm.

