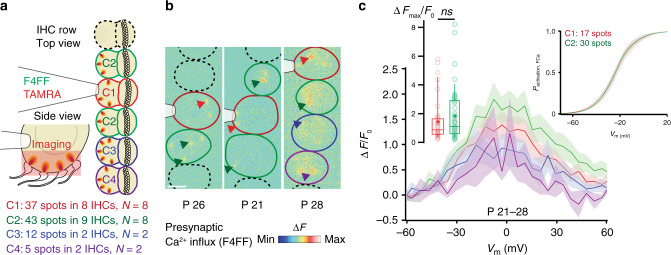
Fig. 7. Collective synaptic activity in IHC mini-syncytia.
a Coupled IHCs (delineated in color) were patch-clamped and loaded with the calcium indicator Fluo-4FF (F4FF) and TAMRA-fluorescent CtBP2-binding peptide. C1 (red) is the patched IHC, C2 (green) are coupled and adjacent to C1, C3 (blue) is coupled to C2 and C4 (violet). The red box shows the imaging plane. b Ca2+-signals co-localizing with the presynaptic ribbons are observable. Example ΔF/F0 pictures from a single plane of the Ca2+-increments (black arrows) of 2 (left), 3 (middle), and 4 (right) coupled IHCs. Non-coupled IHCs are delineated in dashed lines. c The graph displays the fluorescence versus voltage-relationship (ΔF/F0 versus depolarization level), showing presynaptic activity in the coupled IHCs. Left inset show individual values and percentiles (10th, 25th, 50th, 75th and 90th) of ΔFmax/F0 of synapses in C1 (37 spots in 8 IHCs, N = 8) and C2 (43 spots in 9 IHCs, N = 8). Means are indicated as crosses. Right inset displays averaged fractional activation curves of a subset of the spots for which the ΔF/F0 could be fitted faithfully (C1: 17 spots in 7 IHCs, N = 7; C2: 30 spots in 8 IHCs, N = 8). Mean (line) ± S.E.M. (shaded areas) are displayed. IHC inner hair cell. Scale bar: b = 5 µm.

