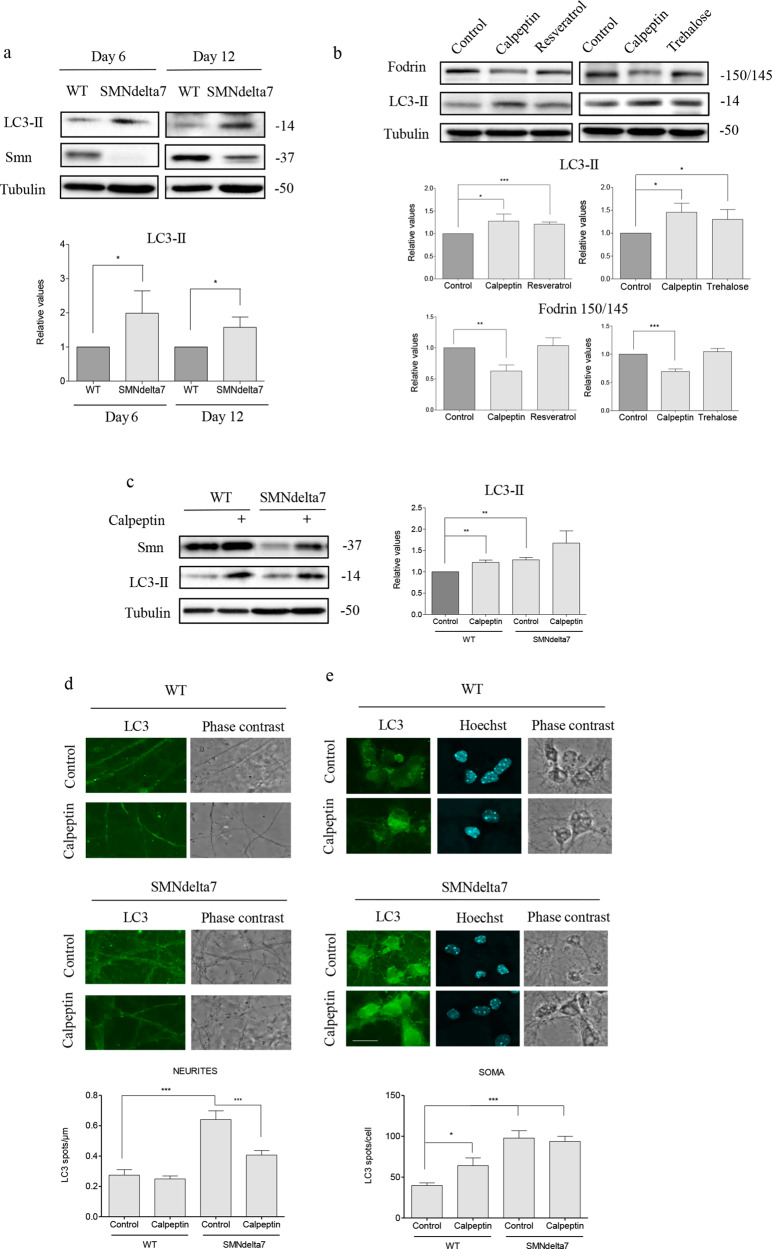
Fig. 6. In vitro analysis of LC3 autophagosome marker in calpeptin treated cells: soma and neuritis.
a WT and SMNdelta7 spinal cord motoneurons (MNs) were isolated and cultured in the presence of a neurotrophic factors cocktail. After 6 and 12 days in vitro protein extracts were obtained and submitted to western blot analysis using an anti-LC3 antibody. Membranes were reprobed with an anti-α-tubulin antibody, used as a loading control. Graph represents the expression of LC3-II corresponding to the quantification of three independent experiments ± SEM. Asterisks indicate differences using Student t test (*p < 0.05). b Isolated CD1 E12.5 mouse MNs were cultured in the presence of a neurotrophic factors cocktail. Six days after plating cells were left untreated or treated with 25 µM calpeptin or 50 nM resveratrol for 12 h; or with 25 µM calpeptin or 100 mM trehalose for 6 h. Total cell lysates were submitted to western blot using an anti-α-fodrin antibody or an anti-LC3 antibody. Membranes were reprobed with an anti-α-tubulin antibody, used as a loading control. Graphs represent the expression of LC3-II or 150/145 fodrin products corresponding to the quantification of 3 independent experiments ± SEM. Asterisks indicate differences using Student t test (*p < 0.05; **p < 0.005; ***p < 0.0001). c WT and SMNdelta7 MNs were cultured in the presence of a neurotrophic factors cocktail. Six days after plating cells were left untreated or treated with 25 µM calpeptin during 3 h. Cells lysates were obtained and submitted to western blot using an anti-SMN antibody or an anti-LC3 antibody. Membranes were reprobed with an anti-α-tubulin antibody, used as a loading control. Graphs represent the expression of LC3-II corresponding to the quantification of three independent experiments ± SEM. Asterisks indicate differences using Student t test (**p < 0.005). d WT and SMNdelta7 MNs were isolated and cultured during 6 days in the presence of a neurotrophic factors cocktail. Cells were treated with 25 μM calpeptin or left untreated during 3 h and immunofluorescence was performed using anti-LC3 antibody (green) (d, e). Representative confocal images of neurites (d) and soma (e) of immunostained MNs. Hoechst (blue) dye was used to identify MN nucleus. Graphs represent the mean of LC3 positive puncta measured in neurites (d) or soma (e) of wild-type (WT) and SMNdelta7 control or calpeptin treated MNs, corresponding to the quantification of tree independent experiments ± SEM. Asterisks indicate significant differences using one-way ANOVA with Bonferroni multiple comparisons post-test (*p < 0.05; ***p < 0.0001). Scale bar, 20 μm.

