Figure 8.
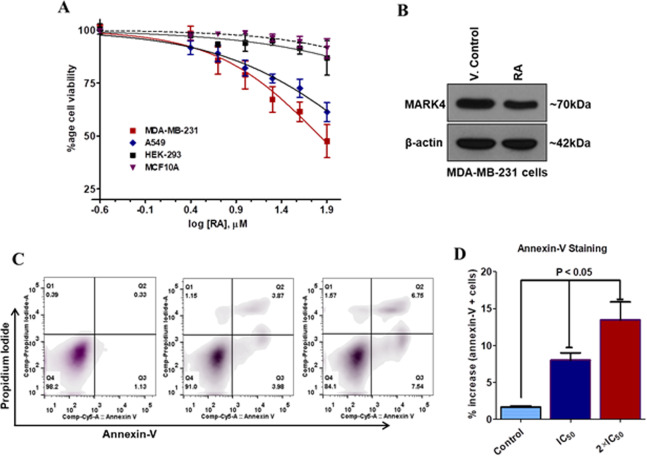
Cell viability, protein expression and apoptosis studies of RA. (A) Cell viability studies of RA with MDA-MB-231, A549, and HEK-293 cells. Each data point shows the mean ± SD from n = 3. (B) Protein expression studies of MARK4 in MDA-MB-231 RA cells treated/vehicle-treated cells. Cells were treated with IC50 concentration of RA for 48 h and total protein was isolated. The expression of the desired protein was accessed using immunoblotting. Raw images of immunoblotting are provided in the supplementary information. (C) Apoptosis induction studies of RA on MDA-MB-231 cells treated with IC50 and 2 × IC50 concentrations for 72 h using Annexin-V/PI staining. (C) Graphical representation of the percent apoptotic cells obtained from Annexin-V/PI staining for triplicate measurements ± SD.

