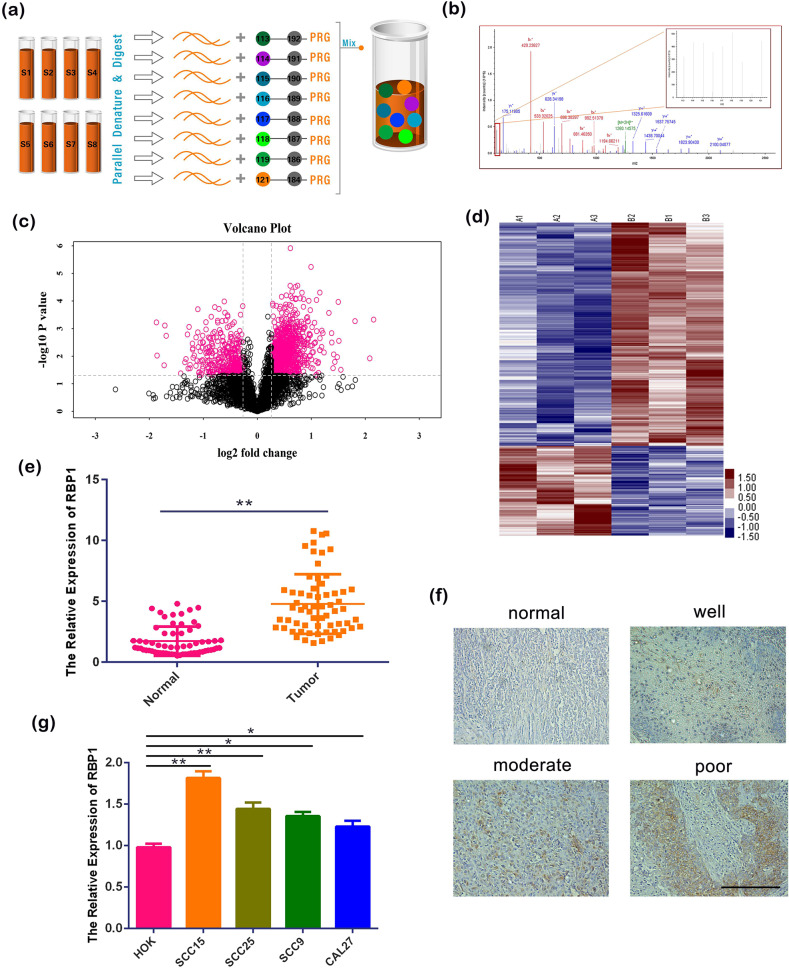
Fig. 1. The expression of RBP1 in patients with OSCC and cell lines.
a, b iTRAQ technical flow chart and mass spectrometry map of a DEP. c, d Volcanic maps and cluster analysis of DEPs. e The expression of RBP1 in 63 pairs of OSCC tissues and normal tissues were analyzed by qRT-PCR. f IHC was used to analyze the expression of RBP1 in 63 pairs of OSCC tissues with different degrees of differentiation and normal tissues. Scale bar: 100 μm. g The expression of RBP1 in OSCC cell lines and HOK cell were analyzed by qRT-PCR. All data were shown as mean ± SD; *P < 0.05, **P < 0.01.

