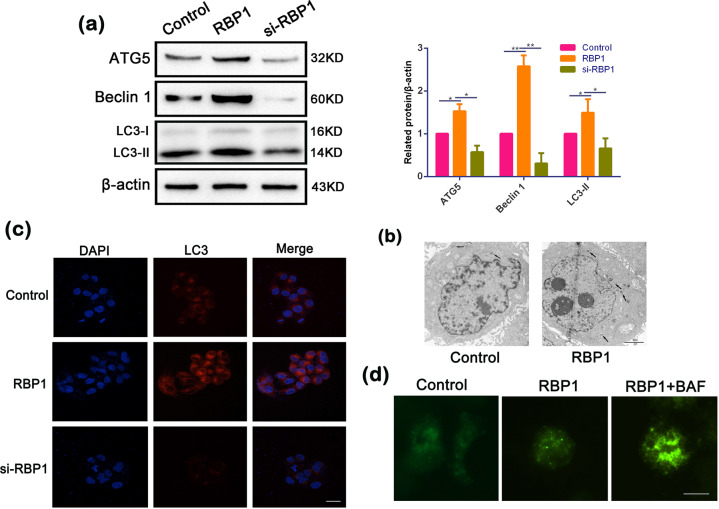
Fig. 4. RBP1-induced autophagy and enhanced autophagic flux in OSCC cells.
a Western blot analysis showing the expression levels of ATG5, BECN1, LC3-II, and β- actin in the cell transfected with control, RBP1 plasmid, or si-RBP1. Quantification of the amount of ATG5, BECN1, and LC3-II to the amount of β- actin for each of the indicated sample. b Electron microscopic examination showing autophagic vacuoles (arrows) in the cytoplasm in the cell transfected with control and RBP1 plasmid. Scale bar: 2 μm. c Immunofluorescent staining showing the number of LC3 dot in the cell transfected with control, RBP1 plasmid, or si-RBP1. Cells were stained by indirect immunofluorescence using anti-LC3 antibody, and the number of LC3 dot per cell was quantified. Scale bar: 20 μm. d RBP1 overexpression enhanced autophagic flux. The number of GFP-LC3 dot in the RBP1-overexpressed cells and control cells treated bafilomycin A1 (BAF). Cells were transfected with GFP-LC3 adenovirus. 24 h after transfection, cells were treated with BAF, then GFP-LC3 dot was examined by fluorescence microscopy. Scale bar: 10 μm; *P < 0.05, **P < 0.01.

