Figure 5.
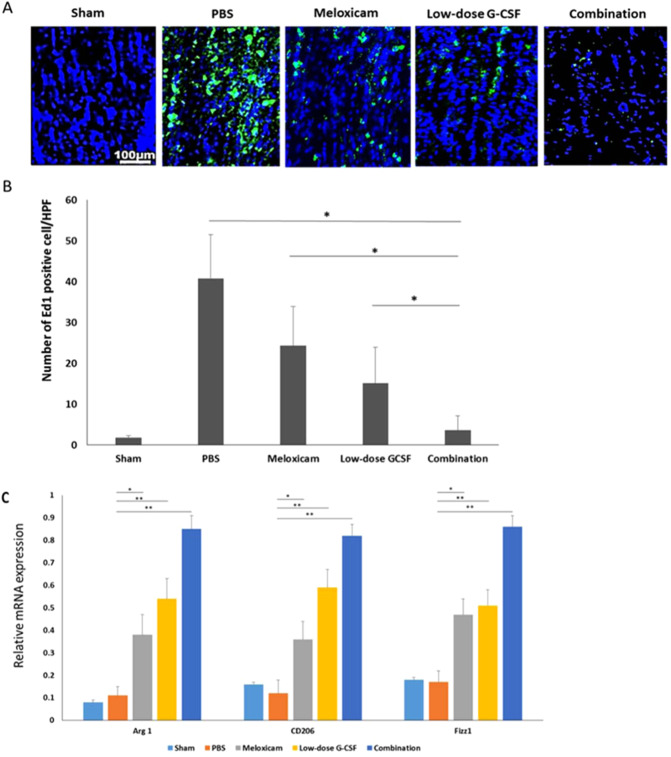
Immunohistochemistry (IHC) of ED1 in the optic nerve at four weeks after rAION induction for evaluating the inflammatory infiltration of macrophages. (A) Representative images of ED1 staining in the longitudinal sections of the optic nerve. The ED1-positive cells in green were stained with FITC, and the nuclei in blue were labeled with DAPI. (B) Quantification of ED1-positive cells per high-power field. Data are expressed as mean ± SD in each group (n = 6). Macrophage recruitment was decreased by 6.75- and 4.1-fold in the combination-treated group compared with the meloxicam-treated and low-dose G-CSF-treated groups, respectively (C) Evaluation of M2 macrophage polarization at four weeks after rAION induction. Relative mRNA expression levels of the markers of M2 macrophages in the optic nerve are shown as histograms. Each value was normalized to CypA. The expression levels of Arg 1, CD206, and Fizz1 (markers of M2 macrophages) increased after treatment with low-dose G-CSF plus meloxicam compared with treatment with PBS-treated group, meloxicam alone, and low-dose G-CSF alone, respectively. *p < 0.05, **p < 0.01.

