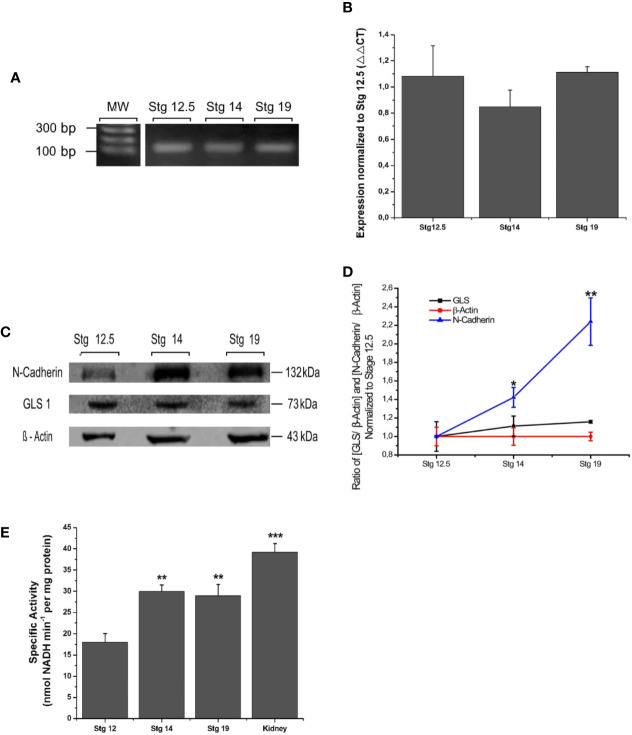
Figure 1.
Expression and functionality of GLS1 during neurulation. (A) PCR assay revealed the presence of GLS transcripts at all neurulation stages and also in the adult brain (n = 5). (B) Transcript quantification using the qPCR assay was normalized to early neurulation. The graph does not show significant differences between stages (n = 6). (C) Protein samples obtained from embryos at stg 12.5, stg 14, and stg 19 were analyzed using the western blot assay to determine GLS1 expression (1:250), using β-actin as a loading control (1:300) and N-cadherin (1:1,000) as a neural tissue positive control. The results revealed the presence of protein in all samples (n = 6). (D) Quantification of western blot results as ratio [GLS/β-actine] and [N-cadherin/β-actin] demonstrate that GLS1 levels are constant during neurulation. (E) GLS1 specific activity expressed as nmol NADH min−1 per protein mass (mg). The graph indicates that GLS1 activity increases in stg 14 and remains the same in stg 19, in both cases the activity is significantly lower than kidney, used as a positive control (n = 8). Results expressed as mean ± SEM, *p < 0.05; **p < 0.01; ***p < 0.001. PCR and WB original results were added to Supplementary Figure S3.

