

Abstract
In this study, phenolic compounds were extracted from Argel leaves using an ultrasound-assisted extraction (UAE) method. The extraction parameters (sonication temperature, time, and ethanol concentration) were optimized using a response surface methodology (Box-Behnken design), in order to maximize the total phenolic content (TPC) and 1,1-diphenyl-2-picrylhydrazyl (DPPH) scavenging activity of Argel leaf extracts (ALEs). The phenolic compounds of the ALEs obtained under optimized conditions were also identified. The optimum UAE conditions for achieving maximum TPC (72.27 g gallic acid equivalents kg−1 DW) and DPPH scavenging activity (86.15%) were a 60 °C temperature, a 37.07 min duration, and a 39.14% ethanol concentration. Under these conditions, the experimental values of TPC and DPPH scavenging activity were 73.02 g GAE kg−1 and 85.56%, respectively, which agreed with the predicted values. In addition, the major phenolic acids found in ALEs under the optimized extraction conditions were sinapic, p-coumaric, and ferulic acid. Overall, the findings of this study demonstrated the suitability of UAE and the success of RSM in optimizing the extraction conditions of bioactive compounds from ALEs.
Electronic supplementary material
The online version of this article (10.1007/s13197-020-04340-6) contains supplementary material, which is available to authorized users.
Keywords: Argel leaf, DPPH scavenging activity, Response surface methodology, Total phenolic content, Ultrasound-assisted extraction
Introduction
Argel (Solenostemma argel Hayne) is a native medicinal plant mainly found in Saudi Arabia, Sudan, and Egypt (Awad et al. 2006). The Argel bark and leaves possess therapeutic properties, such as antioxidant, anti-inflammatory, anti-obesity, and antimicrobial activities (Al-Jaber et al. 2011; Awad et al. 2006; El-shiekh et al. 2019), and are generally used for the treatment of several conditions such as coughs, gastrointestinal cramps, and diabetes (Awad et al. 2006; Boulous 2000). Bioactive compounds, especially phenolic compounds in plants, are able to oxidize low-density lipoproteins in humans (Meyer et al. 1997) and scavenge free radicals in biological systems (Yilmaz and Toledo 2004). Total phenolic content of water and methanolic extracts of Argel leaves were 12.63 g GAE kg−1 (Al-Juhaimi et al. 2018a) and 32.90 g GAE kg−1 (Muddathir et al. 2017), respectively and the variations in phenolic content of these extracts are likely due to the differences in the extraction conditions (Al-Juhaimi et al. 2018a). Recently, Argel leaf powder and extracts have been demonstrated to have natural antioxidant and antimicrobial properties that can have application in extending the shelf life of meat products (Al-Juhaimi et al. 2018a, b). Even though Argel has demonstrated food and medicinal applications, it does not have wide commercial use and consequently additional research that could promote its application is required.
In recent years, there has been increasing interest in identifying natural antioxidants from plants as substitutes for synthetic antioxidants added to foods, due to the adverse effect of the latter on human health (Jayaprakasha et al. 2003). The recovery of these phenolic compounds from plants is mainly dependent on the method of extraction (Lapornik et al. 2005). Solvent extraction by using a water bath is the most commonly known extraction method; the recovery of the targeted compounds is greatly influenced by the solvent concentration and extraction time and temperature (Spigno et al. 2007). However, prolonged exposure to high temperatures during conventional solvent extraction may cause degradation of the phenolic compounds in plant cells and thus reduce the maximum recovery yields of the compounds (Spigno et al. 2007; Yilmaz and Toledo 2006).
Ultrasound-assisted extraction (UAE) is a simple and inexpensive technique that can be applied as an alternative to conventional extraction methods to enhance the extraction of bioactive compounds (Ghafoor et al. 2011). The UAE method involves the production of acoustic cavitation in the solvent through the passage of ultrasonic waves (Wang et al. 2008). In addition, the waves have a mechanical effect, allowing greater penetration of the solvent into the sample matrix, increasing the contact surface area between the solid and liquid phases, and subsequently, the solute rapidly diffuses from the solid phase to the solvent (Rostagno et al. 2003). Another advantage of the UAE method is that it can prevent the chemical degradation of bioactive compounds (Wang and Weller 2006). This technique has been applied to enhance the recovery of bioactive compounds in grape peel and seed (Cho et al. 2006; Ghafoor et al. 2009), barley seed (Ghafoor 2015), and fenugreek seed (Al-Juhaimi et al. 2016), with respect to the recovery achieved by conventional solvent extraction. In order to maximize the recovery of target compounds from Argel leaves using UAE, the extraction parameters need to be optimized. Although the bioactive properties of Argel leaf extracts have been previously studied, no studies have been conducted to optimize the extraction conditions of bioactive compounds from Argel leaves. Therefore, the objective of this study was to use response surface methodology (RSM) approach to optimize UAE parameters such as the solvent concentration and sonication temperature and time, in order to achieve the maximum extraction yields of phenolic and antioxidant compounds from Argel leaves.
Materials and methods
Materials
Fresh green Argel (Solenostemma argel Hayne) leaves were manually collected from Argel plants grown in Sudan. The leaves were manually cleaned to remove dirt, dust, and any remaining stem parts, and then thoroughly washed with distilled water. The leaves were then sun-dried, powdered, packed in polythene bags, and kept in a freezer at − 20 °C to be used for UAE experiments. All chemicals used in the experiments were of analytical grade and obtained from Sigma-Aldrich Co. (St. Louis, MO, USA).
Ultrasound-assisted extraction of bioactive compound from Argel leaves
Phenolic compounds were extracted from Argel leaves using a 2.8 L (dimensions: 230 cm width, 140 cm length, 10 cm depth) ultrasonic bath (2800 CPX, Branson, USA) at a frequency of 40 kHz and a constant power of 110 W. The extraction variables included sonication temperature (40, 50, and 60 °C), sonication time (20, 30, and 40 min), and ethanol concentration (25, 37.5, and 50%; v/v). In the present method, 2 g of Argel leaf powder was placed in a 200 mL flask and mixed with the extraction solvents, followed by ultrasonic irradiation. The temperature and time were controlled via the instrument panel. The flask was cooled to room temperature using cold water and the extracts were then filtered through Whatman No. 1 filter paper. After that, the Argel leaf extracts (ALEs) were analyzed for total phenolic content (TPC) and antioxidant activity. The phenolic profiles of the ALEs obtained under optimum conditions were determined using gas chromatography–mass spectrometry (GC–MS), following the procedure recommended by the instrument manufacturer. All measurements were carried out in triplicate and the obtained data were expressed as means ± standard deviation (SD).
Experimental design
The TPC and antioxidant activity of the ALEs obtained by UAE were optimized using the Design Expert software (trial version 11.0, Stat-Ease Inc., Minneapolis, USA). Response surface methodology, using a Box-Behnken factorial design, was used to determine the optimum combinations of extraction variables needed to maximize the TPC and 1,1-diphenyl-2-picrylhydrazyl (DPPH) scavenging activity of the ALEs. The following sonication parameters were varied in the optimization: sonication temperature (X1: 40, 50, and 60 °C), sonication time (X2: 20, 30, and 40 min), and ethanol concentration (X3: 25, 37.5, and 50%). The TPC and DPPH activity were designated as dependent variables. The process variables used in the experimental design are displayed in Table 1. The results of triplicate measurements of the TPC and DPPH scavenging activity responses were fitted to the second-order polynomial model shown in Eq. (1):
| 1 |
where Y is the predicted response, i.e., the TPC and DPPH scavenging activity from the ALE, and β0 is a constant. Moreover, β1, β2, and β3 are linear regression coefficients, β12, β13, and β23 represent interaction coefficients, and β11, β22, and β33 denote quadratic coefficients. X1 represents sonication temperature, X2 represents sonication time and X3 represents ethanol concentration. Three-dimensional (3D) contour plots were generated using the polynomial equation to visualize the correlation between the dependent variables and the levels of each of the independent variables. Analysis of variance (ANOVA) was conducted to calculate the linear, interaction, and quadratic regression coefficients (β). The fitness of the polynomial equation to the responses was estimated using the coefficient of determination (R2), and the significance of the responses was evaluated at 95% (p < 0.05) confidence levels.
Table 1.
Box-Behnken experimental design of extraction parameters for the optimization of TPC and DPPH scavenging activities of Argel (Solenostemma argel) leaf extracts obtained by UAE
| Run | Independent variables | Dependent variables | |||
|---|---|---|---|---|---|
| X1 | X2 | X3 | TPC (g GAE kg−1 DW) | DPPH (% inhibition) | |
| 1 | 60.00 (+ 1) | 40.00 (+ 1) | 37.50 (0) | 71.79 ± 0.09 | 84.02 ± 0.01 |
| 2 | 40.00 (−1) | 40.00 (+ 1) | 37.50 (0) | 67.23 ± 0.54 | 86.80 ± 0.71 |
| 3 | 50.00 (0) | 30.00 (0) | 37.50 (0) | 68.00 ± 0.54 | 86.80 ± 0.52 |
| 4 | 60.00 (+ 1) | 30.00 (0) | 25.00 (−1) | 70.19 ± 0.00 | 82.63 ± 0.50 |
| 5 | 50.00 (0) | 40.00 (+ 1) | 25.00 (−1) | 65.23 ± 0.09 | 85.41 ± 0.76 |
| 6 | 40.00 (−1) | 30.00 (0) | 50.00 (+ 1) | 69.61 ± 0.27 | 82.63 ± 0.34 |
| 7 | 60.00 (+ 1) | 20.00 (−1) | 37.50 (0) | 68.77 ± 0.18 | 81.94 ± 1.12 |
| 8 | 50.00 (0) | 30.00 (0) | 37.50 (0) | 68.77 ± 0.36 | 82.63 ± 0.01 |
| 9 | 50.00 (0) | 30.00 (0) | 37.50 (0) | 69.41 ± 0.36 | 86.11 ± 0.00 |
| 10 | 50.00 (0) | 30.00 (0) | 37.50 (0) | 68.26 ± 1.63 | 86.80 ± 0.04 |
| 11 | 50.00 (0) | 20.00 (−1) | 25.00 (−1) | 63.11 ± 0.36 | 86.11 ± 0.00 |
| 12 | 50.00 (0) | 30.00 (0) | 37.50 (0) | 68.64 ± 0.36 | 86.11 ± 0.00 |
| 13 | 50.00 (0) | 20.00 (−1) | 50.00 (+ 1) | 70.25 ± 0.45 | 68.05 ± 0.38 |
| 14 | 40.00 (−1) | 20.00 (−1) | 37.50 (0) | 67.35 ± 0.36 | 86.80 ± 0.49 |
| 15 | 40.00 (−1) | 30.00 (0) | 25.00 (−1) | 63.11 ± 0.54 | 88.19 ± 0.02 |
| 16 | 50.00 (0) | 40.00 (+ 1) | 50.00 (+ 1) | 70.89 ± 0.81 | 82.63 ± 0.67 |
| 17 | 60.00 (+ 1) | 30.00 (0) | 50.00(+ 1) | 72.18 ± 0.27 | 82.63 ± 0.42 |
X1: sonication temperature (°C); X2: sonication time (min); X3: ethanol concentration (%)
TPC total phenolic content, DPPH 1,1-diphenyl1-2-picrylhydrazyl scavenging activity
Determination of total phenolic content (TPC)
The TPC in the extracts was quantified using the Folin-Ciocalteu reagent as described by Singleton and Rossi (1965). Briefly, 200 µL of extracts were mixed with 400 µL of Folin-Ciocalteu reagent (100 g L−1) and 4 mL distilled water, and the mixture was thoroughly stirred. After incubation for 10 min at 25 °C, a 1 mL aliquot of Na2CO3 (200 g L−1) was added to the mixture, which was then incubated at 25 °C for 2 h. After that, the absorbance at 765 nm was measured using a Lambda EZ 150 (Perkin-Elmer, USA) spectrophotometer. The total phenolic content was expressed as grams of gallic acid equivalents per kilogram (g GAE kg−1 DW).
Determination of DPPH scavenging activity
The DPPH radical scavenging activity of the extracts was measured as described by Lee et al. (1988). Initially, 0.1 g of DPPH was dissolved in 1 L methanol to prepare a 0.1 g L−1 of DPPH solution. Then, 2 mL of this solution was added to 1 mL of the extract. The mixture was stirred thoroughly and allowed to stand in the dark at room temperature for about 10 min. A control solution was prepared by adding equal volumes of DPPH and methanol. The optical density (OD) of both sample and control was measured using a Lambda EZ 150 (Perkin-Elmer, USA) spectrophotometer at 517 nm, and the DPPH scavenging activity was calculated using the following equation:
| 2 |
GC–MS analysis
The phenolic compounds contained in the ALEs obtained under optimized conditions were detected and quantified using a 7890A (Agilent Technologies, USA) gas chromatography system equipped with a 5975 mass-selective detector and a 7693 automated liquid sampler, fitted with a DB-5MS GC column (30 m length, 0.25 mm inner diameter, and 0.25 µm film thickness). The extract (1 mL) was filtered using a 0.22 µm filter membrane. Standard solutions were prepared by dissolving 10 mg of each standard in 10 mL of high-performance liquid chromatography (HPLC)-grade methanol, yielding 1000 mg L−1 solutions of each standard. One milliliter of each of the standard solutions was then pipetted into a 10 mL volumetric flask, followed by addition of 1 mL hexane to bring the volume to 100 mL, resulting in 10 mg L−1 standard solutions. Then, 10, 7.5, 5, 2.5, and 1.0 mg L−1 standard calibration solutions were prepared from the 100 mg L−1 solution. The filtered extracts and standards were pipetted into a 2 mL mini-vial, derivatized using N,O-bis(trimethylsilyl)trifluoroacetamide) + trimethylchlorosilane (BSTFA + TMCS) reagent, and heated at 70 °C for 4 h, followed by drying under a nitrogen steam. The dried extracts and standards were dissolved in 100 µL of hexane. About 50 µL of the extracts and standard solutions were injected at a temperature of 250 °C, a pressure of 0.68 atm, and an ionizing energy of 70 eV. High-purity (99.995%) helium was used as carrier gas at a constant flow rate of 1.0 mL min−1. The identification of the different phenolic compounds in the extracts was based on the GC retention time, and the mass spectra were matched with those of authentic standards available from GC libraries.
Statistical analysis
All analyses and determinations were carried out in triplicate; the obtained data were analyzed using one-way ANOVA with the SPSS software (version 23.0, IBM Corporation, New York, USA). The Statistica 6.0 (Statsoft Inc., Oklahoma, USA) software was used to generate surface plots. The Duncan multiple range test (DMRT) was used for mean comparison at p < 0.05 level.
Results and discussion
Modeling of the extraction process
Extraction process parameters such as the sonication temperature and time, the solvent type and polarity have a marked influence on the release of phenolic compounds from the solid matrix, and therefore they influence the antioxidant activity of the obtained extract (Ballesteros et al. 2017). In this study, we investigated the effect of extraction variables on the phenolic content and antioxidant activity, and identified their optimum combinations. As shown in Table 1, a Box-Behnken design was applied to optimize the UAE parameters (sonication temperature, time, and solvent concentration) in terms of maximizing the extraction of phenolic and antioxidant compounds from Argel leaves. The TPC ranged from 63.11 to 72.18 g GAE kg−1 and the DPPH inhibition varied from 68.05 to 88.19%, highlighting the considerable influence of the process variables on the evaluated TPC and DPPH responses. The sonication temperature and ethanol concentration had the highest influence on the TPC of the extract. However, these parameters had a negative impact on the DPPH inhibition because the maximum inhibition was observed at lower temperature and ethanol concentrations. Previous reports indicated that ultrasound temperature and ethanol concentration had higher influence on the TPC and antioxidant activity of pomegranate peel (Živković et al. 2018) and Piper betle leaves (Ali et al. 2018).
In order to predict the relationships between the independent and dependent variables, 3D plots were generated from the full model of Eq. (1). The ANOVA, regression coefficients, adequacy of models, and goodness of fit results are summarized in Table 2. The regression coefficients of determination (R2) of the models were 0.953 for TPC and 0.821 for DPPH, indicating that more than 82.1% of the total variability of the response was accounted for by the Eq. (1) model. In addition, the p values (0.001 and 0.05) of TPC and DPPH highlighted the significance of the model terms. Carciochi et al (2015) optimized the UAE of antioxidant phenolic compounds from quinoa seeds using RSM, and observed that the models accounted for more than 88.64% of the total variation of the responses.
Table 2.
Regression coefficients estimated for TPC and DPPH values of Argel (Solenostemma argel) leaf extracts
| Factor | TPC | DPPH | ||||||
|---|---|---|---|---|---|---|---|---|
| Coefficient estimate | Standard error | 95% CI low | 95% CI high | Coefficient estimate | Standard error | 95% CI low | 95% CI high | |
| Intercept | ||||||||
| β0 Linear | 68.62a | 0.3847 | 67.71 | 69.53 | 85.69a | 1.30 | 82.62 | 88.77 |
| β1 | 1.95a | 0.3041 | 1.24 | 2.67 | −1.65 | 1.03 | −4.08 | 0.7839 |
| β2 | 0.7078 | 0.3041 | −0.011 | 1.43 | 2.00 | 1.03 | −0.4366 | 4.43 |
| β3 | 2.66a | 0.3041 | 1.94 | 3.38 | −3.30a | 1.03 | −5.73 | −0.8655 |
| Interaction | ||||||||
| β12 | 0.7883 | 0.4301 | −0.228 | 1.81 | 0.5208 | 1.46 | −2.92 | 3.96 |
| β13 | −1.13a | 0.4301 | −2.14 | −0.1090 | 1.39 | 1.46 | −2.05 | 4.83 |
| β23 | −0.3700 | 0.4301 | −1.39 | 0.6470 | 3.82a | 1.46 | 0.3784 | 7.26 |
| Quadratic | ||||||||
| β11 | 0.7850 | 0.4192 | −0.206 | 1.78 | 1.34 | 1.42 | −2.02 | 4.69 |
| β22 | −0.6145 | 0.4192 | −1.61 | 0.3768 | −2.14 | 1.42 | −5.49 | 1.22 |
| β33 | −0.6306 | 0.4192 | −1.62 | 0.3607 | −3.00 | 1.42 | −6.36 | 0.3504 |
| R2 | 0.9530 | 0.8214 | ||||||
| Adjusted R2 | 0.8925 | 0.5918 | ||||||
| F probability value | 0.001 | 0.053 | ||||||
| Lack of fit probability | 0.087 | 0.073 | ||||||
TPC total phenolic content, DPPH 1,1-diphenyl-1-2-picrylhydrazyl scavenging activity, CI confidence interval
ap < 0.05
Effect of extraction process parameters on TPC
The migration of phenolic compounds from the plant matrix into a solvent brought into contact with the matrix can be enhanced by changing their diffusion coefficients using ultrasonication and high extraction temperatures (Corrales et al. 2009), as well as varying the extraction time and solvent concentration (Wang et al. 2008). The application of ultrasound is beneficial because the ultrasonic waves break the cells of the vegetal matrix, releasing the cell contents into the extraction medium (Vinatoru et al. 1997). Table 1 shows the mean TPCs of ALEs obtained at various experimental UAE conditions. The maximum TPC (72.18 g GAE kg−1 DW) was recorded in the experimental run 17, with a 60 °C sonication temperature, 30 min sonication time, and 50% ethanol concentration. However, the minimum TPC (63.11 g GAE kg−1 DW) was observed in the experimental runs 11 and 15, carried out with sonication temperatures of 50 and 40 °C, sonication times of 20 and 30 min, and 25% ethanol concentration, respectively. Multiple regression analysis was carried out on the experimental data, and the significance of the model coefficients was assessed. The effects of extraction temperature and ethanol concentration on the extraction of phenolic compounds were highly significant (p < 0.05). The TPC coefficients shown in Table 2 were used in the predictive equation below, after neglecting the non-significant cross-terms:
| 3 |
Figure 1 shows 3D surface plots constructed according to Eq. (3), in order to determine the optimum UAE parameters for maximizing the TPCs of Argel leaf extracts. The amount of total phenols was significantly (p < 0.05) affected by the extraction process variables. The effect of sonication time and temperature on the TPC of the ALEs is illustrated in Fig. 1a. At a constant time, the TPC increased gradually as the extraction temperature increased to higher levels. However, the TPC remained unchanged when the sonication time increased at constant temperature (Fig. 1a). As shown in Fig. 1b, a gradual increase in TPC was observed as the sonication temperature increased at fixed ethanol concentration, and the TPC reached its maximum at the highest sonication temperature tested in this study. The TPC increase may be due to the increased swelling of the plant material induced by water, which enlarges the contact surface area between the plant matrix and the solvent (Teng et al. 2009). A similar trend was observed for the TPC as the temperature increased at constant ethanol concentration (Fig. 1b). In addition, the 3D plot of the TPC of ALE versus the ethanol concentration and sonication time is shown in Fig. 1c. In this figure, the TPC of ALE increased gradually to higher levels with the gradual increase in the ethanol concentration, at a constant sonication time, reaching its maximum level at the highest ethanol concentration used in the study. On the other hand, increasing the sonication time at constant ethanol concentration resulted in a slight TPC increase.
Fig. 1.
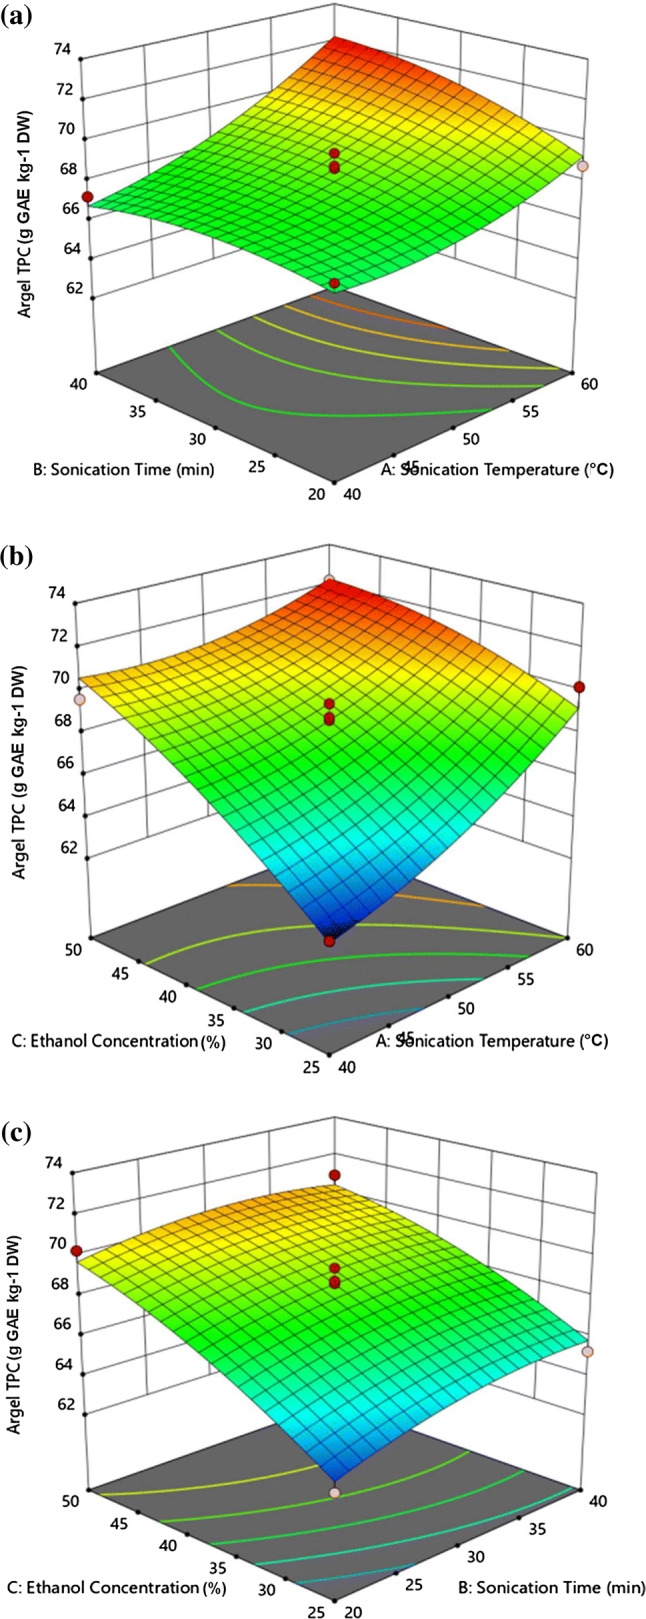
Response surface plot of TPC (g GAE kg−1 DW) of Argel (Solenostemma argel) leaf extracts as a function of a sonication temperature and time, b sonication temperature and ethanol concentration, c sonication time and ethanol concentration
Effect of extraction variables on DPPH scavenging activity
Table 1 shows the average values of the DPPH scavenging activity of the ALEs for each experimental run. The maximum DPPH scavenging activity (88.19% inhibition) was recorded in the experimental run 15, involving a sonication temperature of 40 °C, a sonication time of 30 min, and an ethanol concentration of 25%. However, the minimum DPPH scavenging activity (68.05% inhibition) was observed in the experimental run 13, performed with 50 °C sonication temperature, 20 min sonication time, and 50% ethanol concentration. Multiple regression analysis of the data revealed that the DPPH scavenging activity of the ALEs were significantly (p < 0.05) affected by the linear ethanol concentration term and the interaction term between ethanol concentration and sonication time (Table 2). This could be attributed to the increased diffusion of the compounds into the solvent with increasing solid-solvent contact time (Corrales et al. 2009). The predictive equation for the DPPH scavenging activity of the ALEs, including only the significant terms, can be formulated as:
| 4 |
The three-dimensional plots shown in Fig. 2 reveal that the DPPH scavenging activity was affected by the extraction process variables in a way different from that observed for the TPC. As shown in Fig. 2a, the antioxidant activity gradually increased with increasing sonication time and approached its maximum value at the highest sonication time. However, the antioxidant activity slightly decreased with increasing ethanol concentration at a fixed temperature and remained nearly unchanged with increasing sonication temperature at constant ethanol concentration (Fig. 2b). Similarly, the DPPH scavenging activity markedly decreased with increasing ethanol concentration at constant sonication time (Fig. 2c).
Fig. 2.
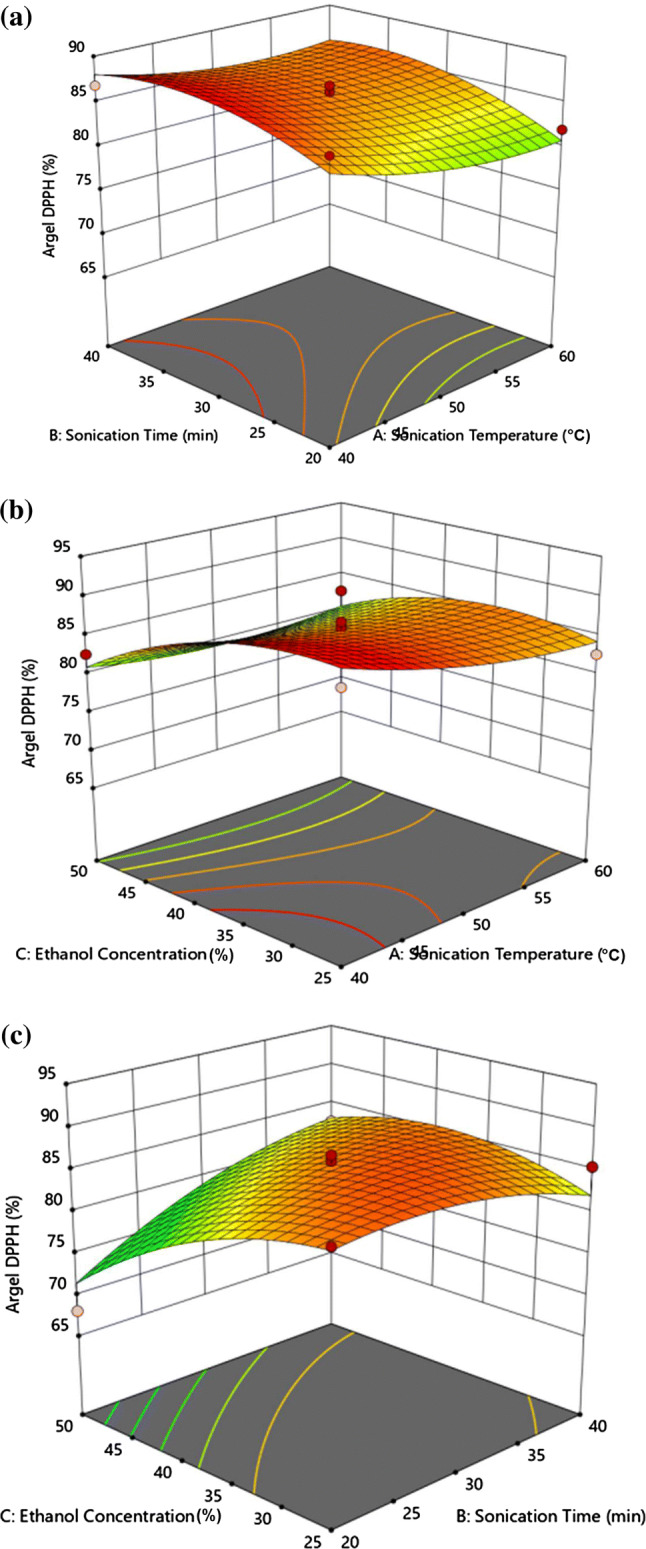
Response surface plot of DPPH scavenging activity (%) of Argel (Solenostemma argel) leaf extracts as a function of a sonication temperature and time, b sonication temperature and ethanol concentration, c sonication time and ethanol concentration
Optimization of the extraction process
Table 3 shows the TPC and DPPH scavenging activity (response variables) of ALEs obtained under the optimum UAE conditions. The predicted UAE conditions for obtaining the maximum TPC (72.77 g GAE kg−1 DW) involved a 60 °C sonication temperature, a 39.19 min sonication time, and a 49.24% ethanol concentration, whereas the corresponding optimum conditions for the maximum DPPH scavenging activity (91.0% inhibition) were 40 °C, 24.4 min, and 25.0% ethanol concentration. Experimental analyses of the TPC and DPPH scavenging activity of the ALEs were conducted for each response using the optimized extraction conditions, and the obtained results were compared with the predicted results. The experimental results obtained for TPC (73.02 g GAE kg−1 DW) and DPPH scavenging activity (85.56% inhibition) were close to the predicted results, which validated the RSM model. Moreover, a desirability function approach was used to predict one set of optimum conditions for maximum TPC and DPPH scavenging activity. By using a scale of 0 (completely undesirable response) to 1 (fully desirable response), a total desirability value of 0.95 was recorded in the experiment. At this desirability level, UAE from Argel leaves using a 60 °C temperature, a 37.07 min duration, and 39.14% ethanol concentration can result in a TPC and DPPH scavenging activities of 72.27 g GAE kg−1 and 86.15% inhibition, respectively.
Table 3.
Optimum conditions and validation of predicted and experimental values obtained under the same conditions
| Response variables | Optimum extraction conditions | Maximum values | |||
|---|---|---|---|---|---|
| Sonication temperature (°C) | Sonication time (min) | Ethanol concentration (%) | Predicted | Experimentala | |
| Individual responses | |||||
| TPC (g GAE kg−1 DW) | 60.0 | 39.19 | 49.24 | 72.77 | |
| DPPH (% inhibition) | 40.0 | 24.40 | 25.00 | 91.00 | |
| Combined responses | |||||
| TPC (g GAE kg−1 DW) | 60.0 | 37.07 | 39.14 | 72.27 | 73.02 |
| DPPH (% inhibition) | 86.15 | 85.56 | |||
TPC total phenolic content, DPPH 1,1-diphenyl1-2-picrylhydrazyl scavenging activity
aMean (n = 3)
Phenolic compounds in ALEs
The phenolic compounds contained in the ALEs obtained under optimized sonication conditions are shown in Table 4 and Figure S1. The ALEs contained eight different phenolic compounds, categorized mainly as phenolic acids. The predominant phenolic acid was sinapic acid (23.683 mg kg−1 DW), followed by p-coumaric, ferulic, and 4-hydroxybenzoic acids. However, small quantities of other compounds were also identified, with gallic acid exhibiting the lowest content (0.583 mg kg−1 DW). Argel leaves and hairy seeds have been reported to possess high contents of phenolic and flavonoid compounds such as catechin, rutoside, monoterpenes, acylated phenolic glycosides, and pregnane (Amariei et al. 1991; Hassan et al. 2001; Kamel 2003; Ounaissia et al. 2016). The antioxidant and antimicrobial activities of these phenolic compounds were comparable with those of synthetic antioxidant and antimicrobial agents (Bhattacharya et al. 2016; Santos et al. 2016). Overall, our findings showed that high levels of phenolic compounds in Argel leaf extracts could be achieved by UAE under the optimized conditions identified in the study. The enhancement of phenolic content and antioxidant activity by the UAE approach could be due to the breakage of the cells of the plant matrix by ultrasound waves, resulting in the release of the cell contents into the solvent (Vinatoru et al. 1997). Furthermore, sonication simultaneously improves the hydration and fragmentation processes while increasing the rate of mass transfer of solutes into the extraction medium (Toma et al. 2001). The present study demonstrated that the use of UAE for the extraction of phenolic compounds was as effective as any other high-temperature and long-term (12 to 24 h) extraction process commonly used for some plants, such as red grape pressed marc (Lapornik et al. 2005); this is because the present approach could markedly reduce the extraction time and employ a less concentrated organic solvent. Therefore, the UAE method can enhance existing extraction approaches and enable new commercial extraction processes (Vilkhu et al. 2008).
Table 4.
Properties of phenolic acid compounds in Argel leaf extracts obtained under optimized sonication conditions
| Phenolic compound | Argel leaf extract | |
|---|---|---|
| Retention time (min) | Amount (mg kg−1 DW) | |
| Syringic acid | 25.993 | 4.398 |
| Caffeic acid | 29.729 | 3.851 |
| Sinapic acid | 31.257 | 23.683 |
| Ferulic acid | 29.008 | 10.409 |
| Vanillic acid | 23.653 | 3.588 |
| p-coumaric acid | 26.565 | 16.077 |
| trans-cinnamic acid | ND | ND |
| Gallic acid | 27.109 | 0.583 |
| 4-hydroxybenzoic acid | 21.095 | 9.417 |
ND not detected
Conclusion
The current study investigated the effects of the sonication conditions (temperature, time, and ethanol concentration) on the DPPH scavenging activity and total phenolic content of Argel leaf extracts. The UAE process parameters and response variables were optimized using an RSM model. The independent processing variables (especially the ethanol concentration and the extraction temperature) greatly affected the extraction of phenolic compounds from Argel leaves and the DPPH scavenging activity of the extracts. Significant matches were observed between the predicted and experimental values of TPC and DPPH activity. Significant amounts of various phenolic compounds were found in the ALE obtained by using the optimum UAE conditions. The findings of this study indicated that the Argel leaf could be an excellent source of functional ingredients, with possible applications in different food products.
Electronic supplementary material
Below is the link to the electronic supplementary material.
Acknowledgements
The authors extend their appreciation to the Deanship of Scientific Research at King Saud University for funding this work through research group number RG‐1439‐080. We thank Professor Alan Carne (Department of Biochemistry, University of Otago, New Zealand), Professor Abu ElGasim A Yagoub (Department of Food Science and Nutrition, King Saud University, Saudi Arabia), and RSSU (Deanship of Scientific Research, King Saud University, Saudi Arabia) for the assistance in proof reading and English editing of this manuscript.
Compliance with ethical standards
Conflict of interest
The authors declare that there are no conflicts of interest.
Ethical approval
This study does not contain any studies with human or animal subjects.
Footnotes
Publisher's Note
Springer Nature remains neutral with regard to jurisdictional claims in published maps and institutional affiliations.
References
- Ali A, Lim XY, Chong CH, Mah SH, Chua BL. Optimization of ultrasound-assisted extraction of natural antioxidants from Piper betle using response surface methodology. LWT Food Sci Technol. 2018;89:681–688. doi: 10.1016/j.lwt.2017.11.033. [DOI] [Google Scholar]
- Al-Jaber NA, Awaad AS, Moses JE. Review on some antioxidant plants growing in Arab world. J Saudi Chem Soc. 2011;15:293–307. doi: 10.1016/j.jscs.2011.07.004. [DOI] [Google Scholar]
- Al-Juhaimi F, Adiamo OQ, Ghafoor K, Babiker EE. Optimization of ultrasonic-assisted extraction of phenolic compounds from fenugreek (Trigonella foenum-graecum L.) seed. CyTA-J Food. 2016;14:369–374. doi: 10.1080/19476337.2015.1110202. [DOI] [Google Scholar]
- Al-Juhaimi FY, Shahzad SA, Ahmed AS, Adiamo OQ, Mohamed Ahmed IA, Alsawmahi ON, Ghafoor K, Babiker EE. Effect of Argel (Solenostemma argel) leaf extract on quality attributes of chicken meatballs during cold storage. J Food Sci Technol. 2018;55:1797–1805. doi: 10.1007/s13197-018-3094-1. [DOI] [PMC free article] [PubMed] [Google Scholar]
- Al-Juhaimi FY, Mohamed Ahmed IA, Adiamo OQ, Adisa AR, Ghafoor K, Ozcan MM, Babiker EE. Effect of Argel (Solenostemma argel) leaf powder on the quality attributes of camel patties during cold storage. J Food Process Preserv. 2018;42:e13496. doi: 10.1111/jfpp.13496. [DOI] [PMC free article] [PubMed] [Google Scholar]
- Amariei D, Stanescu U, Gille E, Onisei T. The biosynthetic capacity of the active principles of in vitro regenerated Solenostemma argel (SEL) Hayne, callus and shoots. Revue Roumaine de Biologie, Serie de Biologie Vegetale. 1991;38:71. [Google Scholar]
- Awad AI, Eltayeb IB, Capps PA. Self-medication practices in Khartoum state. Sudan Eur J Clin Pharmacol. 2006;62:317. doi: 10.1007/s00228-006-0107-1. [DOI] [PubMed] [Google Scholar]
- Ballesteros LF, Ramirez MJ, Orrego CE, Teixeira JA, Mussatto SI. Optimization of autohydrolysis conditions to extract antioxidant phenolic compounds from spent coffee grounds. J Food Eng. 2017;199:1–8. doi: 10.1016/j.jfoodeng.2016.11.014. [DOI] [Google Scholar]
- Bhattacharya D, Bhattacharya S, Patra MM, Chakravorty S, Sarkar S, Chakraborty W, Koley H, Gachhui R. Antibacterial activity of polyphenolic fraction of kombucha against enteric bacterial pathogens. Curr Microbiol. 2016;73:885–896. doi: 10.1007/s00284-016-1136-3. [DOI] [PubMed] [Google Scholar]
- Boulous L. Flora of Egypt. Egypt: Al Hadara Publishing; 2000. [Google Scholar]
- Carciochi RA, Manrique GD, Dimitrov K. Optimization of antioxidant phenolic compounds extraction from quinoa (Chenopodium quinoa) seeds. J Food Sci Technol. 2015;52:4396–4404. doi: 10.1007/s13197-014-1514-4. [DOI] [PMC free article] [PubMed] [Google Scholar]
- Cho Y-J, Hong J-Y, Chun HS, Lee SK, Min H-Y. Ultrasonication-assisted extraction of resveratrol from grapes. J Food Eng. 2006;77:725–730. doi: 10.1016/j.jfoodeng.2005.06.076. [DOI] [Google Scholar]
- Corrales M, García AF, Butz P, Tauscher B. Extraction of anthocyanins from grape skins assisted by high hydrostatic pressure. J Food Eng. 2009;90:415–421. doi: 10.1016/j.jfoodeng.2008.07.003. [DOI] [Google Scholar]
- El-shiekh RA, Al-Mahdy DA, Mouneir SM, Hifnawy MS, Abdel-Sattar EA. Anti-obesity effect of Argel (Solenostemma argel) on obese rats fed a high fat diet. J Ethnopharmacol. 2019;238:111893. doi: 10.1016/j.jep.2019.111893. [DOI] [PubMed] [Google Scholar]
- Ghafoor K. Optimized extraction of phenolic compounds from barley (Hordeum vulgare L.) seed and their radical scavenging properties. J Food Proc Pres. 2015;39:793–799. doi: 10.1111/jfpp.12289. [DOI] [Google Scholar]
- Ghafoor K, Choi YH, Jeon JY, Jo IH. Optimization of ultrasound-assisted extraction of phenolic compounds, antioxidants, and anthocyanins from grape (Vitis vinifera) seeds. J Agric Food Chem. 2009;57:4988–4994. doi: 10.1021/jf9001439. [DOI] [PubMed] [Google Scholar]
- Ghafoor K, Hui T, Choi YH. Optimization of ultrasonic-assisted extraction of total anthocyanins from grape peel using response surface methodology. J Food Biochem. 2011;35:735–746. doi: 10.1111/j.1745-4514.2010.00413.x. [DOI] [Google Scholar]
- Hassan HA, Hamed AI, El-Emary NA, Springuel IV, Mitome H, Miyaoka H. Pregnene derivatives from Solenostemma argel leaves. Phytochemistry. 2001;57:507–511. doi: 10.1016/S0031-9422(01)00121-2. [DOI] [PubMed] [Google Scholar]
- Jayaprakasha G, Selvi T, Sakariah K. Antibacterial and antioxidant activities of grape (Vitis vinifera) seed extracts. Food Res Int. 2003;36:117–122. doi: 10.1016/S0963-9969(02)00116-3. [DOI] [Google Scholar]
- Kamel M. Acylated phenolic glycosides from Solenostemma argel. Phytochemistry. 2003;62:1247–1250. doi: 10.1016/S0031-9422(03)00022-0. [DOI] [PubMed] [Google Scholar]
- Lapornik B, Prošek M, Wondra AG. Comparison of extracts prepared from plant by-products using different solvents and extraction time. J Food Eng. 2005;71:214–222. doi: 10.1016/j.jfoodeng.2004.10.036. [DOI] [Google Scholar]
- Meyer AS, Yi O-S, Pearson DA, Waterhouse AL, Frankel EN. Inhibition of human low-density lipoprotein oxidation in relation to composition of phenolic antioxidants in grapes (Vitis vinifera) J Agric Food Chem. 1997;45:1638–1643. doi: 10.1021/jf960721a. [DOI] [Google Scholar]
- Muddathir AM, Yamauchi K, Batubara I, Mohieldin EAM, Mitsunaga T. Anti-tyrosinase, total phenolic content and antioxidant activity of selected Sudanese medicinal plants. South Afr J Bot. 2017;109:9–15. doi: 10.1016/j.sajb.2016.12.013. [DOI] [Google Scholar]
- Ounaissia K, Pertuit D, Mitaine-Offer A-C, Miyamoto T, Tanaka C, Delemasure S, Dutartre P, Smati D, Lacaille-Dubois M-A. New pregnane and phenolic glycosides from Solenostemma argel. Fitoterapia. 2016;114:98–104. doi: 10.1016/j.fitote.2016.08.002. [DOI] [PubMed] [Google Scholar]
- Rostagno MA, Palma M, Barroso CG. Ultrasound-assisted extraction of soy isoflavones. J Chromatogr A. 2003;1012:119–128. doi: 10.1016/S0021-9673(03)01184-1. [DOI] [PubMed] [Google Scholar]
- Santos GA, Vila MM, Chaud MV, Silva WL, de Castro AG, de Oliveira Jr JM, Tubino M, Balcao VM. Antimicrobial and antioxidant screening of curcumin and pyrocatechol in the prevention of biodiesel degradation: oxidative stability. Biofuels. 2016;7:581–592. doi: 10.1080/17597269.2016.1168023. [DOI] [Google Scholar]
- Spigno G, Tramelli L, De Faveri DM. Effects of extraction time, temperature and solvent on concentration and antioxidant activity of grape marc phenolics. J Food Eng. 2007;81:200–208. doi: 10.1016/j.jfoodeng.2006.10.021. [DOI] [Google Scholar]
- Teng H, Ghafoor K, Choi YH. Optimization of microwave-assisted extraction of active components from Chinese quince using response surface methodology. J Korean Soc Appl Biol Chem. 2009;52:694–701. doi: 10.3839/jksabc.2009.115. [DOI] [Google Scholar]
- Toma M, Vinatoru M, Paniwnyk L, Mason TJ. Investigation of the effects of ultrasound on vegetal tissues during solvent extraction. Ultrasonics Sonochem. 2001;8:137–142. doi: 10.1016/S1350-4177(00)00033-X. [DOI] [PubMed] [Google Scholar]
- Vilkhu K, Mawson R, Simons L, Bates D. Applications and opportunities for ultrasound assisted extraction in the food industry—a review. Innov Food Sci Emerg Technol. 2008;9:161–169. doi: 10.1016/j.ifset.2007.04.014. [DOI] [Google Scholar]
- Vinatoru M, Toma M, Radu O, Filip P, Lazurca D, Mason T. The use of ultrasound for the extraction of bioactive principles from plant materials. Ultrasonics Sonochem. 1997;4:135–139. doi: 10.1016/S1350-4177(97)83207-5. [DOI] [PubMed] [Google Scholar]
- Wang L, Weller CL. Recent advances in extraction of nutraceuticals from plants. Trends Food Sci Technol. 2006;17:300–312. doi: 10.1016/j.tifs.2005.12.004. [DOI] [Google Scholar]
- Wang J, Sun B, Cao Y, Tian Y, Li X. Optimisation of ultrasound-assisted extraction of phenolic compounds from wheat bran. Food Chem. 2008;106:804–810. doi: 10.1016/j.foodchem.2007.06.062. [DOI] [Google Scholar]
- Yilmaz Y, Toledo RT. Health aspects of functional grape seed constituents. Trends Food Sci Technol. 2004;15:422–433. doi: 10.1016/j.tifs.2004.04.006. [DOI] [Google Scholar]
- Yilmaz Y, Toledo RT. Oxygen radical absorbance capacities of grape/wine industry byproducts and effect of solvent type on extraction of grape seed polyphenols. J Food Comp Anal. 2006;19:41–48. doi: 10.1016/j.jfca.2004.10.009. [DOI] [Google Scholar]
- Živković J, Šavikin K, Janković T, Ćujić N, Menković N. Optimization of ultrasound assisted extraction of polyphenolic compounds from pomegranate peel using response surface methodology. Sep Puri Technol. 2018;194:40–47. doi: 10.1016/j.seppur.2017.11.032. [DOI] [Google Scholar]
Associated Data
This section collects any data citations, data availability statements, or supplementary materials included in this article.