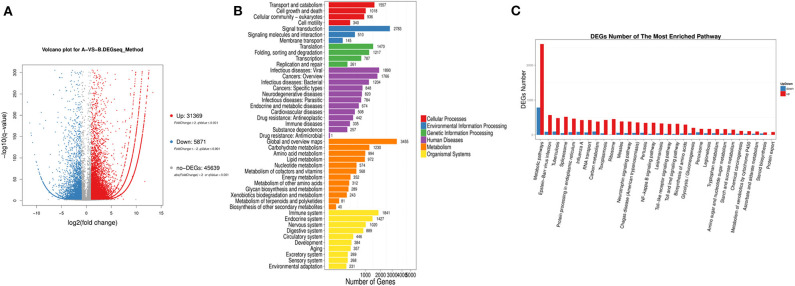
Figure 2.
Classification of differentially expressed genes based on transcriptome sequencing. (A) Volcano-plot distribution of the differentially expressed gene (red represents the up-regulated gene, blue represents the down-regulated gene, and gray represents the indistinguishable gene). (B) Pathway classification map of the differentially expressed genes. (C) Up-regulation or down-regulation differentially expressed genes of different pathway.

