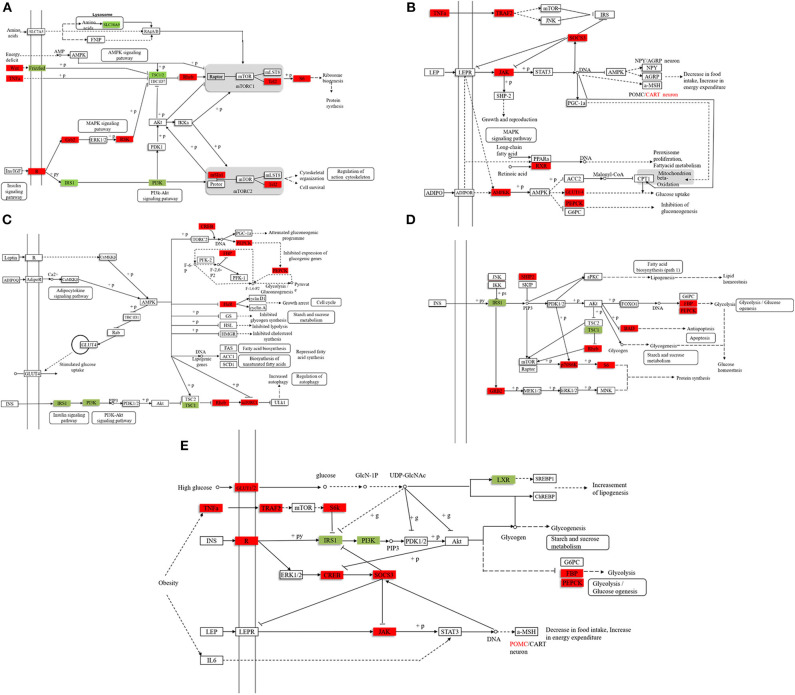
Figure 3.
The representative pathways of differentially expressed genes. (A) The mTOR signaling pathway. (B) The adipocytokine signaling pathway. (C) The AMP-activated protein kinase pathway. (D) The insulin signaling pathway. (E) The glycogen metabolism pathway. Compared with the stable feeding artificial diet group, the red marker indicates that the expression level of the gene is higher, and the green marker indicates that the expression level of the gene is lower. (The filtering condition is FDR ≤ 0.01 and the value of |log2[Ratio]| ≥ 1, and the differentially expressed genes excludes the genes that are not differentially expressed between Group A and C to eliminate the effect of hunger on the mRNA and protein expression levels).

