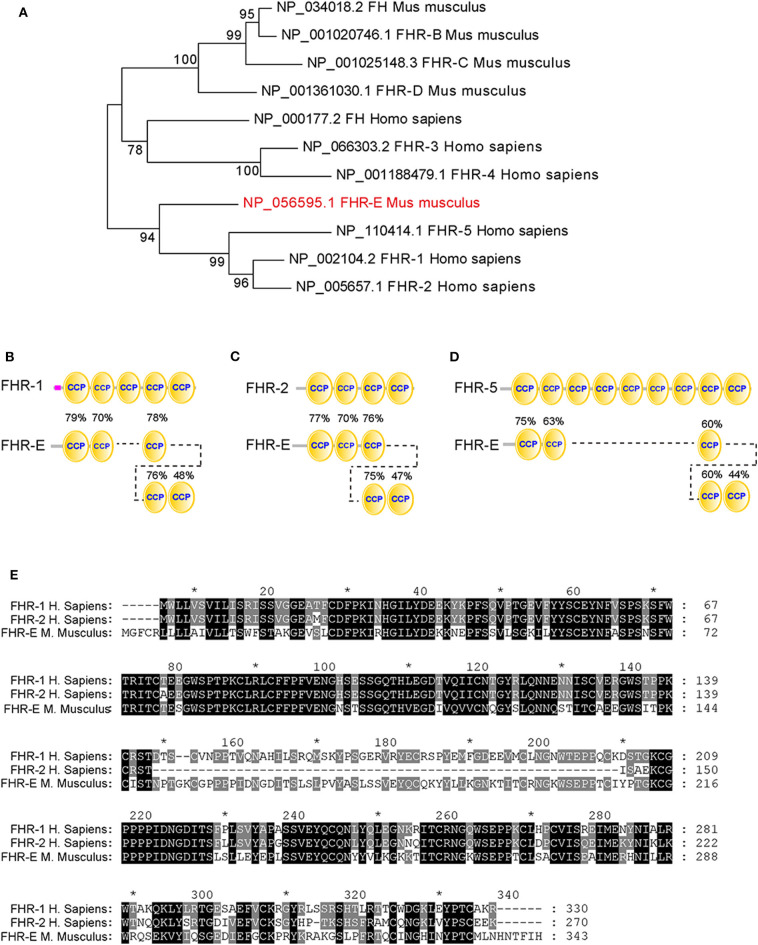
Figure 1.
Homology analysis of different FHRs between human and mouse. (A) The evolutionary tree of different FHRs in human and mouse. The percentage of replicate trees in which the associated taxa clustered together in the bootstrap test (1,000 replicates) were shown next to the branches. (B–D) The similarity analyses between FHR-E and human FHR-1, FHR-2, and FHR-5. The percentages marked on these figures denote the similarities between the CCP domains of FHR-E and human FHR-1, FHR-2, and FHR-5. (E) The sequence alignment of FHR-E and human FHR-1 and FHR-2. * Indicates the number of amino acid. It was marked every twenty amino acids.

