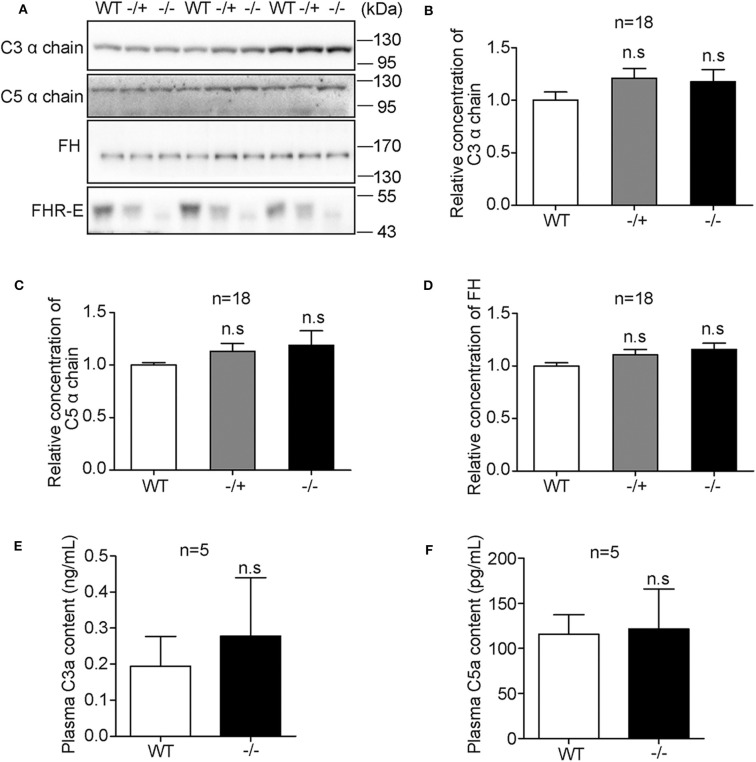
Figure 3.
Detection of plasma levels of major complement factors among mice of different genotypes under physiological conditions. (A) Representative Western blotting analyses of plasma C3, C5, FH, and FHR-E. Equal volume of plasma was loaded. Eighteen mice in each group were included. (B–D) The gray values of C3, C5, and FH were measured with Image J. The calculated gray values of each blot were divided by the average gray value of wild type in the blot. (E,F) Measurements of plasma concentration of C3a and C5a with ELISA kit. EDTA anti-coagulant blood was obtained from heart puncture. Five mice in each group were used. Very low background absorption was detected in different genotype mice. n.s., not significant.

