Figure 8.
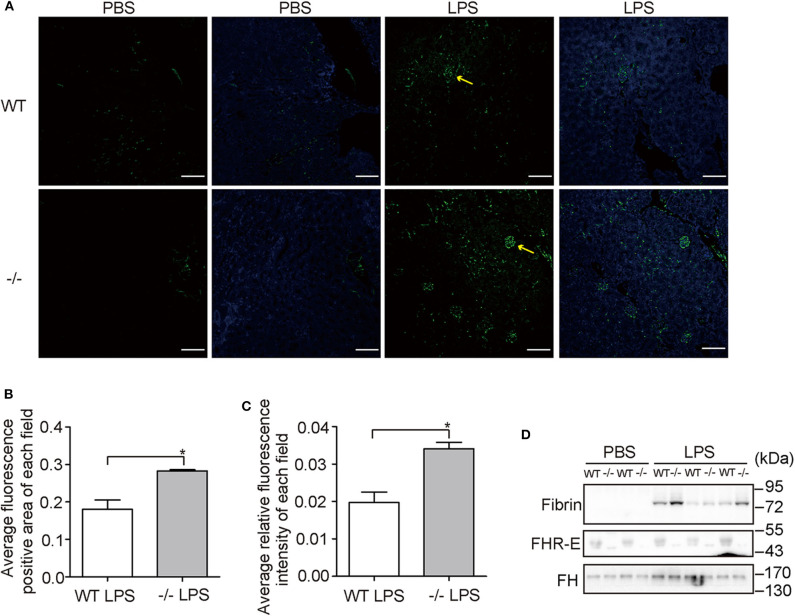
Vascular damage examinations. Three mice in each group were used. (A) Immunostaining of fibrin on kidney sections. Pictures were taken at a magnification of 200×. The green signals indicate fibrin. The blue signals indicate total nuclei stained with DAPI. Arrows point to the fluorescence positive area. The bar is 50 μM. (B) Comparison of fluorescence positive area between WT and Cfhr1−/− mice. Fluorescence positive area of each field was calculated by Image J. Twenty non-overlapped fields were counted and averaged. (C) Comparison of fluorescence intensity between wild-type and Cfhr1−/− mice. Fluorescence intensity of each field was calculated by Image J. Twenty non-overlapped fields were counted and averaged. (D) Western blotting analysis of plasma fibrin of 12 h after LPS challenge. Western blotting of FHR-E was performed to determine the genotypes. Equal volumes of plasma were loaded. The Western blotting of FH on the same blot was regarded as an internal control. *p < 0.05.

