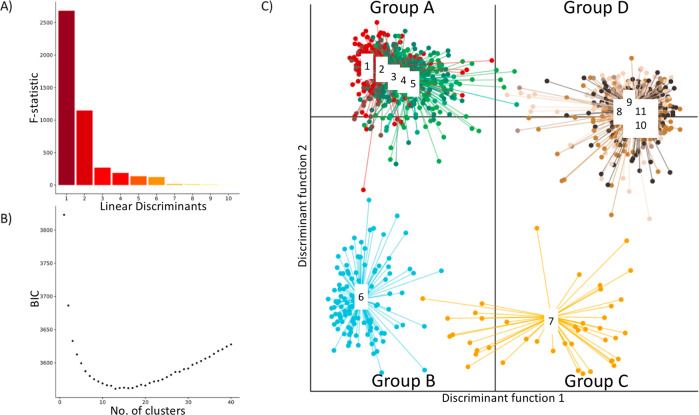
Fig. 2. Clustering of COLO829 single-cells using Discriminant Analysis of Principal Components (DAPC).
a Bar plot of eigenvalues, which corresponds to the ratio of the variance between groups over the variance within groups for each discriminant function. b Inference of optimal cluster number using Bayesian Information Criterion (BIC). c Scatterplots showing the inference of population structure in 1373 cells using the first two principal components of the DAPC analysis. Individual dots represent single-cells and the color represents cluster assignment.

