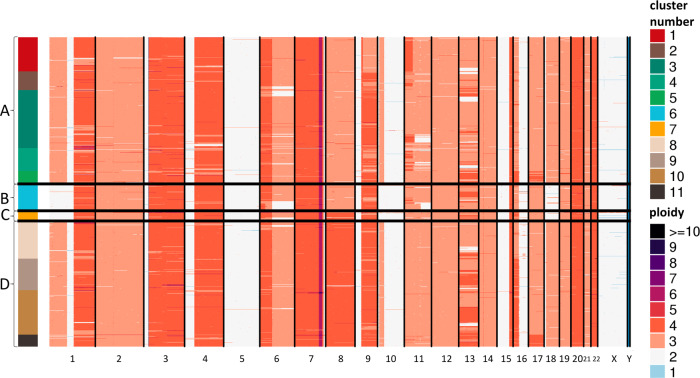
Fig. 3. single-cell copy number heatmap of COLO829.
Heatmap showing hierarchical clustering of 1,373 single-cell CNV profiles at 2 Mb resolution. Each row depicts the whole genome of a single-cell, colors (Group A: clusters 1–5 [red, brown, greens], Group B: cluster 6 [blue], Group C: cluster 7 [yellow], Group D: clusters 8–11 [browns]) represent the called ploidy as specified by the legend on the right and rows are clustered by groups (Group A: 653 cells, Group B: 117 cells, Group C: 43 cells, Group D: 560). Hierarchical clustering was performed calculating the distance between each single-cell CNV data to posteriorly join them into groups. The 11 clusters (upper right) were calculated from the inference of optimal cluster number analysis. Ploidy number (lower right) is represented by distinct colors.

