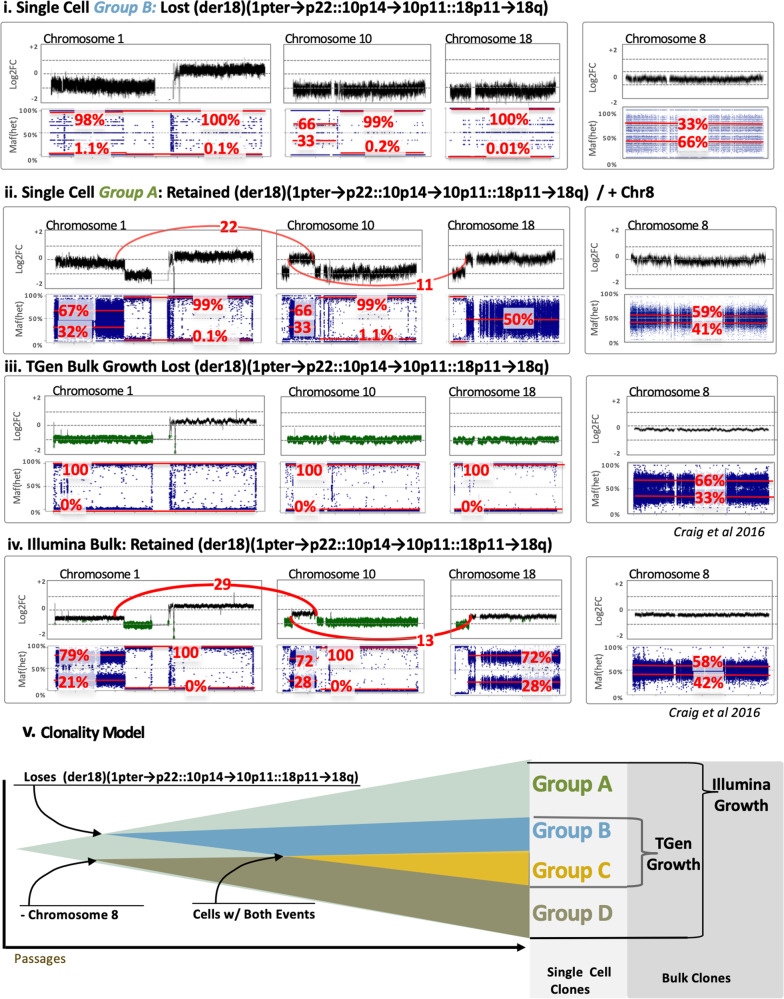
Fig. 4. Log2Fold힓 (upper in each) and Het SNP allele frequency (lower blue in each) for (i) Group B and (ii) Group A, (iii) Illumina Bulk Sample, and (iv) TGen Bulk Sample.
The upper graph of each panel provides an estimated log2 fold change (noting bulk copy number does not inherently produce copy number estimates). For the chromosome 1, 10, and 18 via (p22.3;10p14) and t(p11.22;18p11.22), counts of anomalous reads supporting the junction are shown in red, whereas this event is absent in Group B and C, as well as the TGen Sample. The lower plots of each panel are the allele fraction of known heterozygous SNPs (identified from previous VCFs in the germline lymphocyte lines) for COLO829. Their deviation from the expected 50% allele fraction provides an indication of Loss of Heterozygosity (LOH), where the relative noise is dependent on the number of reads over an SNP and greater spread is observed in groups with fewer reads. The median major/minor allele fractions are provided for each region in red. (v) A Schematic model of the major clones shows a simple model whereby the sub-clones emerge as some cells do not maintain the abnormal chr1p-10q-18q line and/or change in chromosome 8 copy number.

