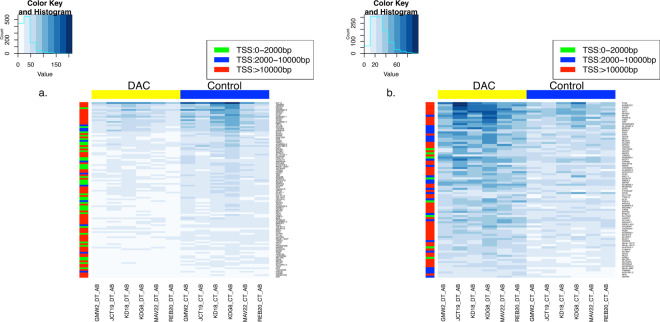
Figure 4.
Heatmaps showing the global changes in H3K9 acetylation in AML patient samples treated with DAC. Purified mononuclear cells from bone marrow samples from six AML patients were treated with DAC 500 nM for 72 h and H3K9 acetylation was analyzed by ChIP-Seq as described under methods. The right panel (a) shows the panel of the 102 genes showing H3K9 acetylation decrease after DAC treatment and the left panel (b) shows the panel of the 85 genes showing H3K9 acetylation increase after DAC treatment. The colored scale at the right of the heatmap shows the position of acetylation change relative to the Transcription Start Site (TSS). The histogram inset at the top shows the value (read count of the peaks) against the count (the number of times those read counts are observed in the heatmap).

