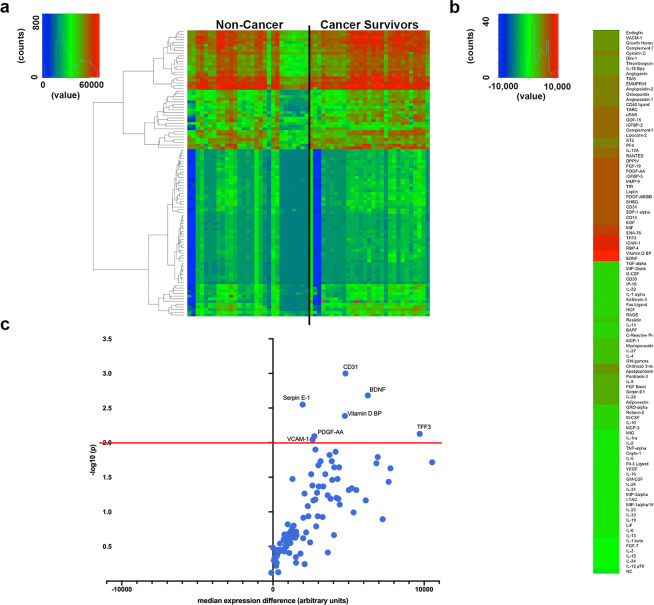
Figure 2.
Serum cytokine expression in cancer survivors and non-cancer participants. (a) Heatmap depicting cytokine expression among cancer survivors and non-cancer participants. (b) Individual cytokine differences between cancer survivors and non-cancer participants. Higher (red) to lower (green) differences among groups. (c) Volcano plot depicting cytokine changes (x-axis) and p-values (statistical significance was established as p < 0.01; y-axis).

