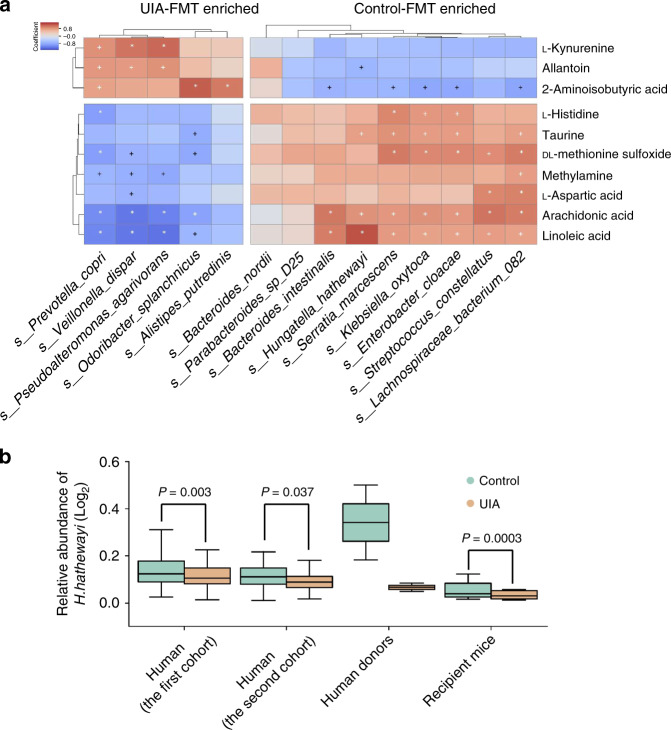
Fig. 7. Associations of gut microbial H. Hathewayi with circulating taurine in mice.
a Heat maps of Spearman’s rank correlation coefficients between 10 altered metabolites and 14 differentially abundant gut microbial species. +P < 0.05, *P < 0.01. Pairs with low correlations (|r| < 0.4) are not shown (n = 10). b Relative abundances of H. hathewayi in two cohorts of UIA patients (n = 100; n = 40), Human donors (n = 2), and mice that received fecal microbiota transplantation (FMT) from UIA patients or controls (n = 10). Two-tailed Wilcoxon rank-sum test. In all box plots, boxes represent the interquartile ranges (IQRs) between the first and third quartiles, and the line inside the box represents the median; whiskers represent the lowest or highest values within 1.5 × IQR from the first or third quartiles.

