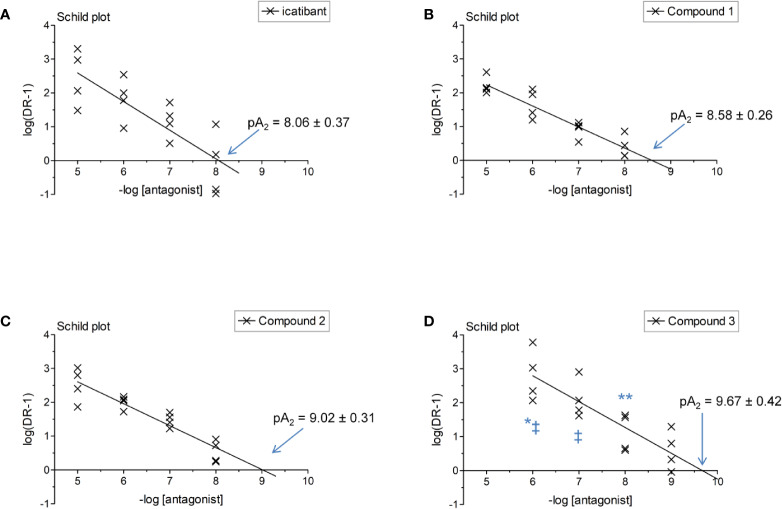
Figure 4.
Schild plot analysis of Figure 3 data where a point in the regression represents one day of experimental data for a given antagonist concentration. The identity of the tested antagonist is icatibant (A), Compound 1 (B), Compound 2 (C) and Compound 3 (D). Two-way ANOVA indicated that the antagonist drug identity and concentration determined the variation of log(DR-1) values (P < 10-4 for each). Values different from those of icatibant: *P < 0.05; **P < 0.01; values different from those of Compound 1: ‡P < 0.05 (Bonferroni post-hoc test).

