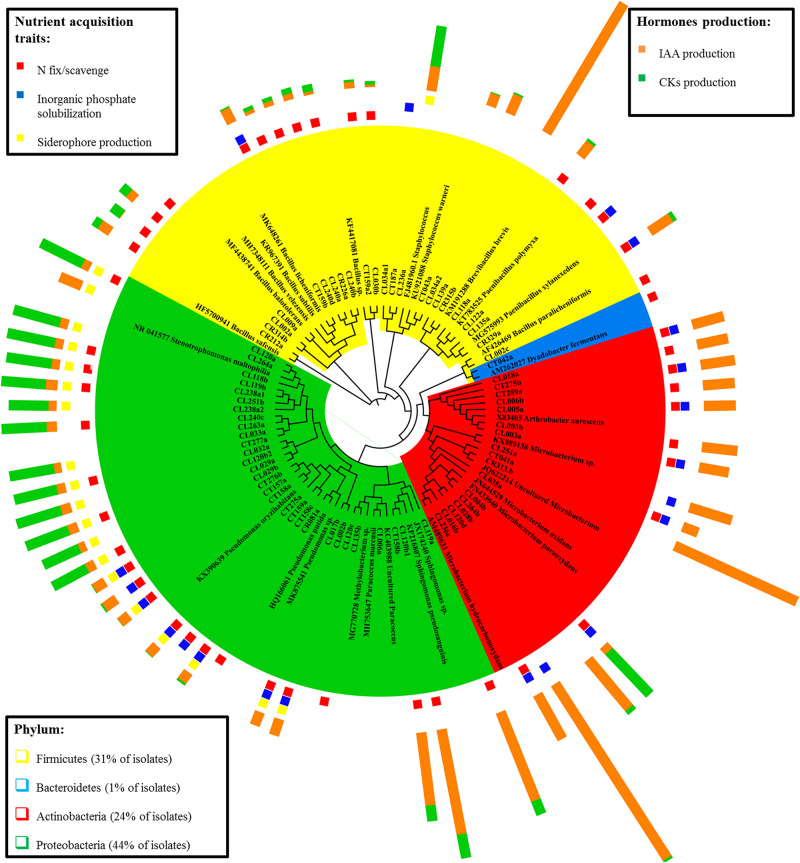
FIGURE 1.
Cladogram representing the identification of the endophytic bacterial isolates and the corresponding plant growth promotion traits. Isolates are grouped by their sequence similarity to the BLASTn reference sequence. Phylum taxonomic level is showed by color: Firmicutes (yellow), Bacteroidetes (blue), Actinobacteria (red), and Proteobacteria (green). Plant growth promotion traits are separated by nutrient acquisition traits (presence or absence) and hormone production.

