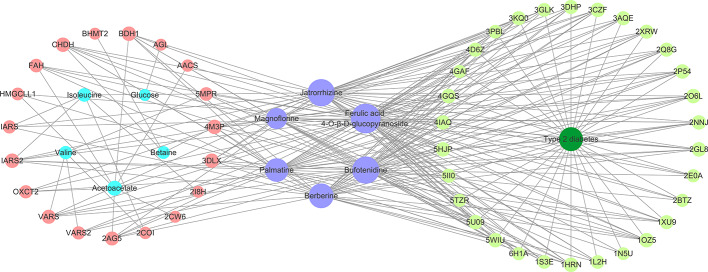
Figure 6.
The constructed compound-protein-metabolite-disease (CPMD) interaction network revealed the correlation between chemical constituents, target proteins, differential metabolites, and type 2 diabetes. Pink and pale green circles represent target proteins related to differential metabolites and type 2 diabetes, respectively; blue, purple, and dark green represent differential metabolites, compounds, and disease, respectively.

