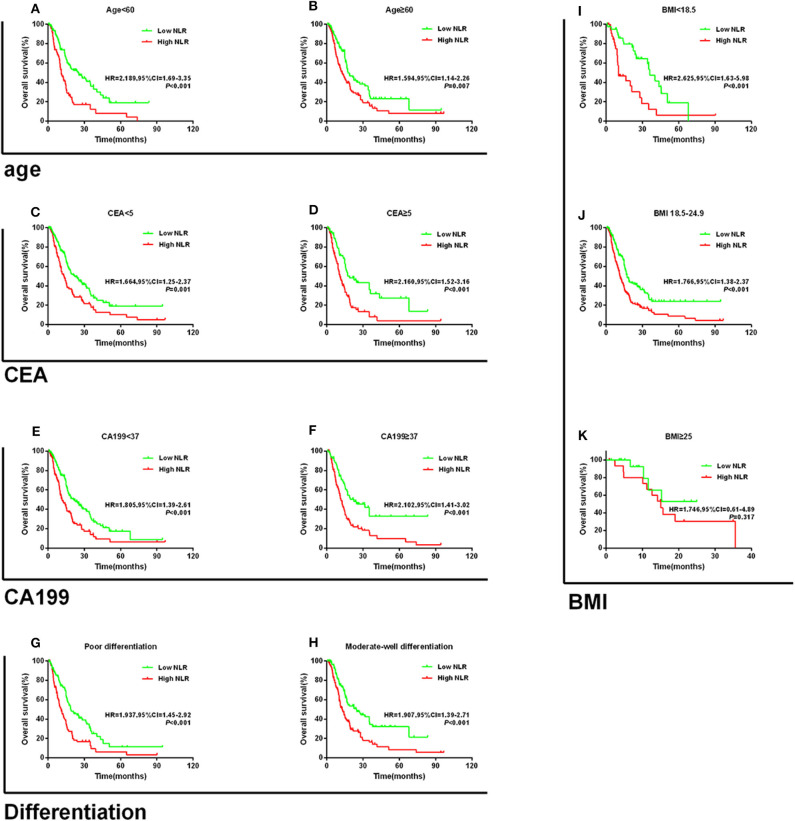
Figure 3.
Kaplan–Meier survival curves for overall survival in patients stratified by NLR median for (A) age < 60 and (B) age ≥ 60; (C) CEA < 5; (D) CEA ≥ 5; (E) CA199 < 37; (F) CA199 ≥ 37; (G) poor differentiation; (H) moderate-well differentiation; (I) BMI < 18.5; (J) BMI 18.5–24.9; and (K) BMI ≥ 25.

