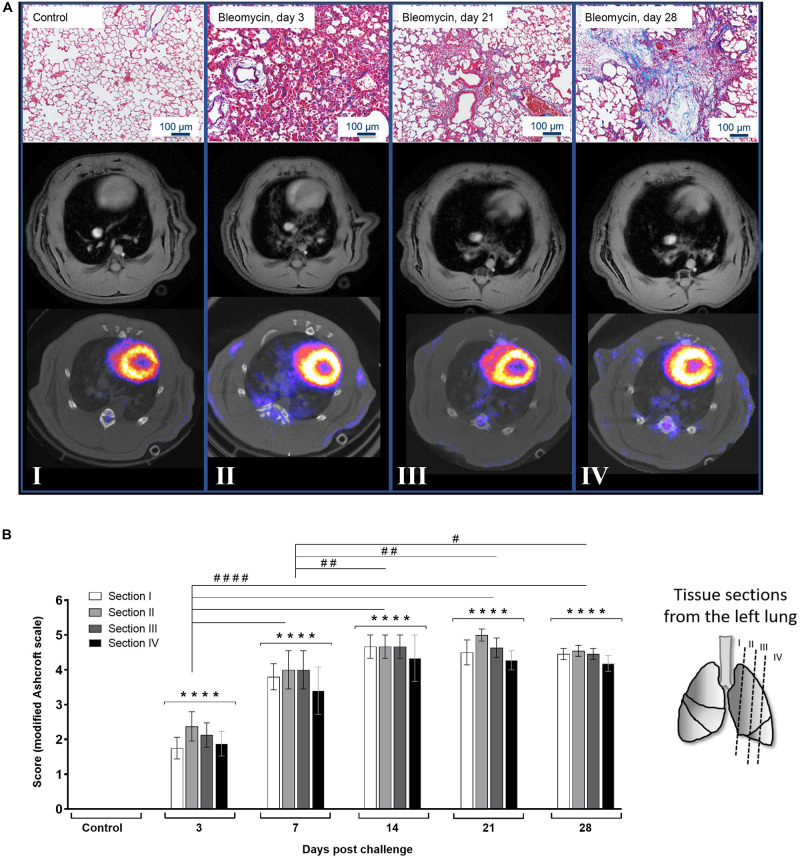
FIGURE 3.
Histology and lung images at various time points post bleomycin challenge. (A) Representative images from Masson’s-Trichrome staining presented at baseline/control (I), day 3 (II), day 21 (III), and day 28 (IV) post bleomycin challenge, in association to MRI- and PET/CT images of the lungs. All images acquired during the imaging scan sessions were used for quantitative analysis, where data were extracted within the lung-ROI, which is defined in Supplementary Figure S2. (B) Scoring of the histological staining where histological sections were collected from different positions in the left lung lobe of the sacrificed rats. After applying the modified Ashcroft fibrosis score (scale ranging from 0 to 8), the scoring results indicate fibrotic progression over time while infiltration of inflammatory cells ceased and was cleared over time. Statistical comparison between sections at each time point was not significantly different, indicating even distribution of injury throughout all lung sections in each animal. Scoring variation between groups was compared and indicated by **** when p < 0.0001 when comparing bleomycin towards the saline control. The comparison of various time points between bleomycin-challenged groups is expressed as # when p < 0.05; ## when p < 0.01 and #### when p < 0.0001.

