FIGURE 4.
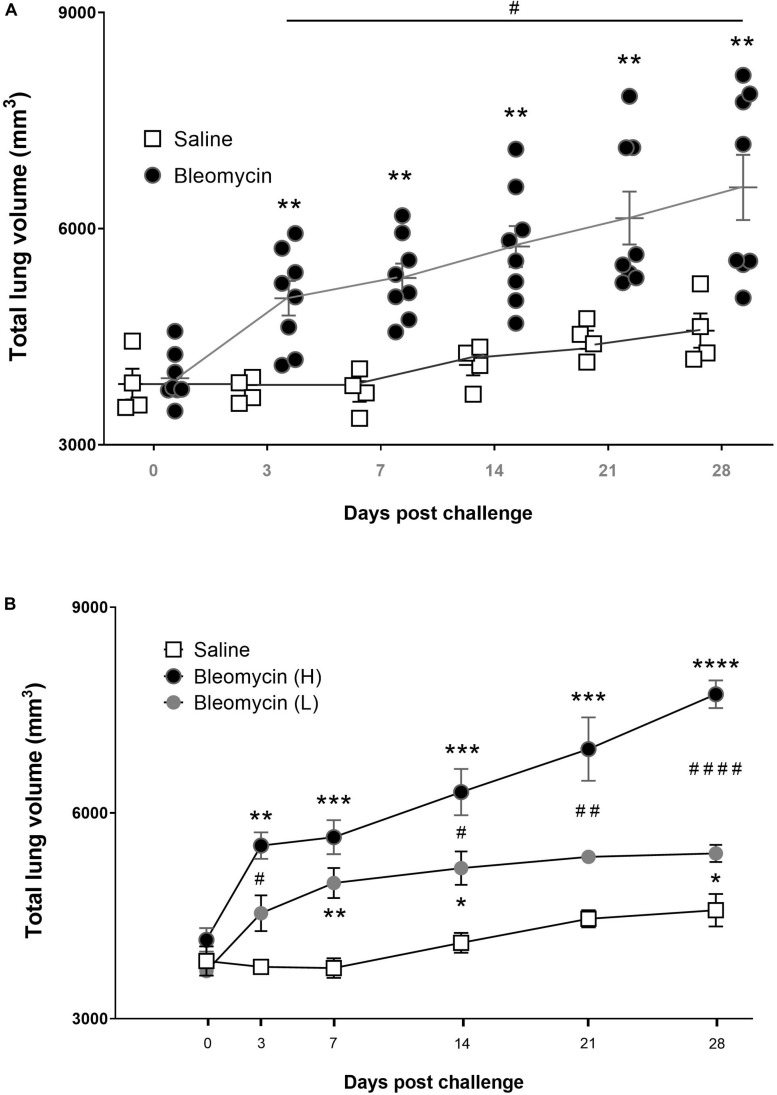
Lung volume changes post bleomycin challenge. (A) Total lung volume presented as mm3 in saline vs. bleomycin groups for all measured time points. The total lung volume data are generated from the MR-images with ROI, showing here that bleomycin challenge induced an increase in total lung volume compared to saline control. Later time points (day 21–28) revealed segmented populations of rats that responded differently, where the total lung volume change was further increased or recovered back toward baseline, being high- and low-responders, respectively. (B) Total lung volume change presented according to the different groups; saline, low-responders (L) and high-responders (H). Significance is indicated by * when p < 0.05; p < 0.01 by **; p < 0.001 by *** and p < 0.0001 by ****, when comparing bleomycin towards the saline control from the same time point. The comparison of various time points between bleomycin-challenged groups is expressed as # when p < 0.05; ## when p < 0.01 and #### when p < 0.0001.

