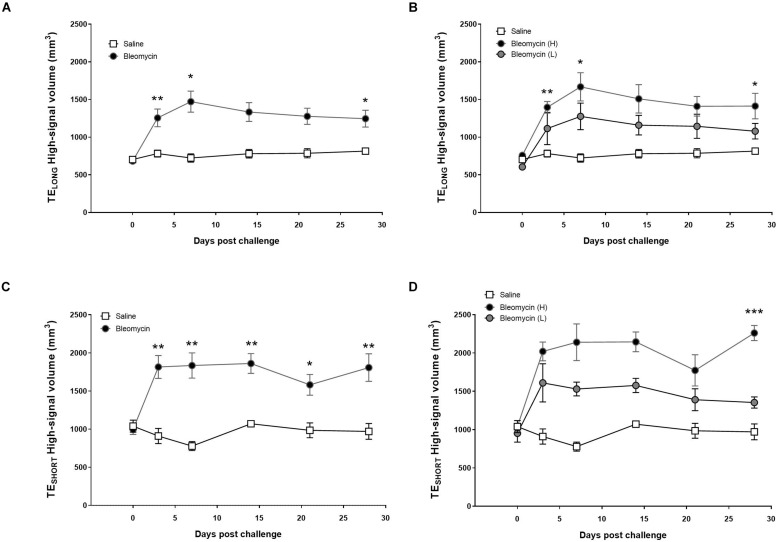
FIGURE 5.
Observation of the high MRI signal from TELONG and TESHORT measurements, showing lesions from inflammation and fibrosis. (A) The high-MRI signal volume, applying TELONG, in saline vs. bleomycin-challenged rats (n = 8). (B) When splitting the bleomycin group in high- vs. low-responders (n = 4 + 4), it is evident that the volume of assessed lesions is being reduced to similar levels as saline controls, while the high-responder group showed continuous large volume of the lesions at the last scan session (day 28). (C) Measuring the high signal throughout the various time points with the TESHORT, displayed mainly fibrosis at later stage, in saline vs. bleomycin-challenged rats (n = 8). (D) The TESHORT measurement that identifies the high signal presented according to the split bleomycin groups in high- vs. low-responders (n = 4 + 4). Here the lesion volume is starting to recover toward saline controls in the low-responders, while the high-responder group showed progressive disease in forms of fibrotic lesions increasing significantly in volume, at the last scan session (day 28). Significance is indicated by * when p < 0.05; p < 0.01 by ** and p < 0.001 by ***, when comparing bleomycin towards the saline control from the same time point.

